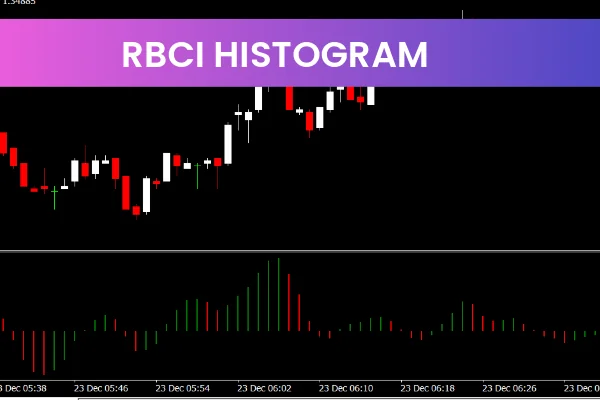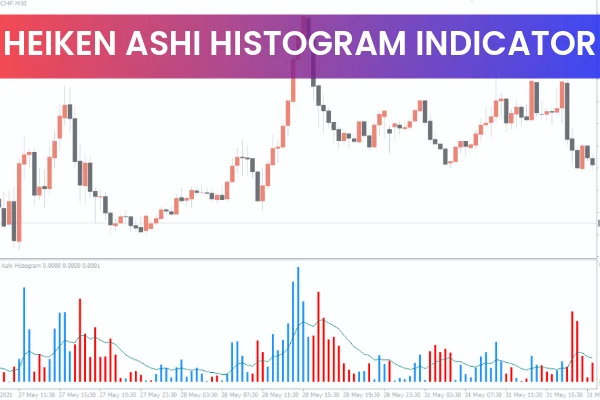
You guessed it right—Heiken Ashi is a Japanese term meaning “average bar.” The Heiken Ashi Histogram Indicator for MT4 is an improved visual version of the classic Heiken Ashi oscillator, displaying trend momentum through colored histogram bars combined with a moving average line.
One major advantage of this indicator is its simplicity. The histogram uses blue bars for bullish sentiment and red bars for bearish sentiment. Long stretches of uniform color often indicate strong and reliable trends compared to short two- or three-bar moves.
The indicator also analyzes historical market data, helping traders quickly identify market tendencies not easily seen with Price Action alone.
Best of all, the Heiken Ashi Histogram indicator is universal, meaning it works on:
All MT4 timeframes
All forex pairs and instruments
Swing trading
Intraday/day trading
Scalping strategies
How the Heiken Ashi Histogram Indicator Works
The indicator generates trading signals when the histogram bars change color and cross the moving average. This crossover suggests the trend is gaining momentum and may continue for a while.
The moving average also acts as a filter, signaling whether the market is trending or ranging.
In other words:
A blue bar above the moving average = potential bullish continuation
A red bar below the moving average = potential bearish continuation
These signals help traders confirm whether a trend is strong enough to open a position.
How to Trade Using the Heiken Ashi Histogram Indicator
Identify the Bar Colors
Blue → Uptrend bias
Red → Downtrend bias
However, bar color alone is not enough to enter a trade.
Wait for a Crossover
A valid signal occurs only when the histogram bar crosses the moving-average line.
Buy Signal: Blue bars rise above the MA line → bullish trend strengthening
Sell Signal: Red bars drop below the MA line → bearish trend strengthening
The farther the histogram moves after crossing the MA, the stronger the trend becomes.
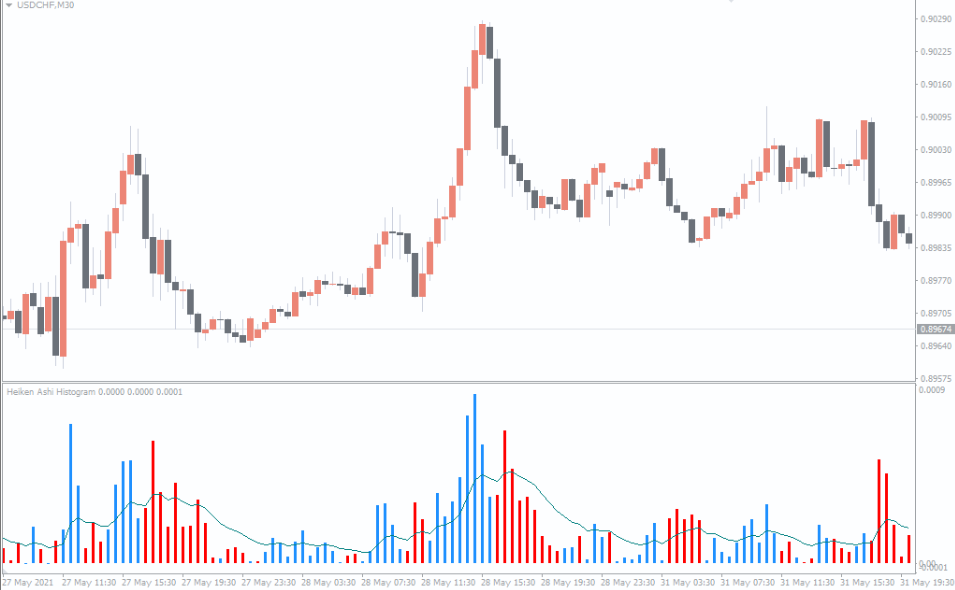
Example Analysis
In the example of GBP/CHF, the red bars crossing below the moving average revealed the start of a strong bearish move—price dropped over 100 pips, offering excellent profit potential.
Likewise, the blue bars later crossed above the moving average, signaling a bullish reversal that delivered about 50 pips of upward momentum.
Final Word
The Heiken Ashi Histogram Indicator for MT4 is a simple yet powerful trend-momentum tool. It helps traders identify when a trend is likely to strengthen and offers clear visual confirmations. While effective on its own, it works best when combined with other technical tools such as:
Price action patterns
Trendlines
Moving averages
Volume analysis
This indicator is straightforward, beginner-friendly, and should definitely be included in your trading toolbox.
FAQ
5 Downloads
Published:
Dec 05, 2025 12:32 PM
Category: