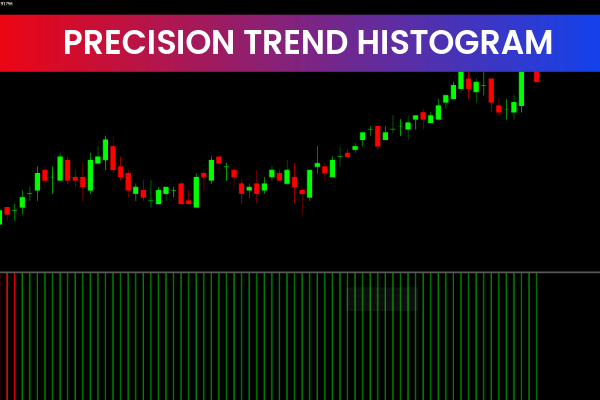
The Precision Trend Histogram Indicator is a custom and highly accurate Forex Indicator designed for the MetaTrader 4 platform. It analyzes price behavior and visually displays market trend direction using histogram bars, making it easier for traders to interpret trend conditions and market momentum.
Optimized for precision, the Precision Trend Histogram Indicator is suitable for scalpers, intraday traders, and swing traders alike. Its sensitivity to price changes allows traders to identify trend continuation zones as well as potential trend reversals with improved accuracy. Due to its simple visual design, it is also well suited for beginners and experienced Forex traders.
How the Precision Trend Histogram Indicator Works
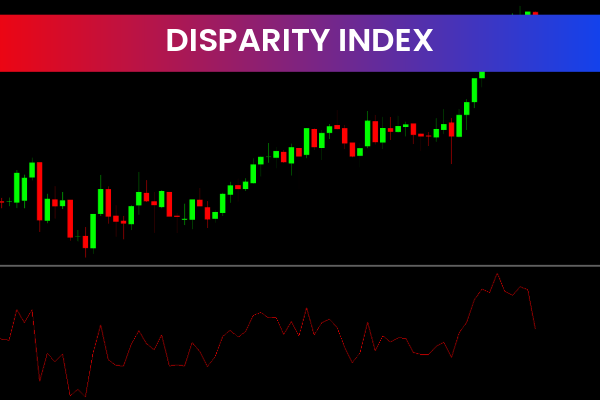
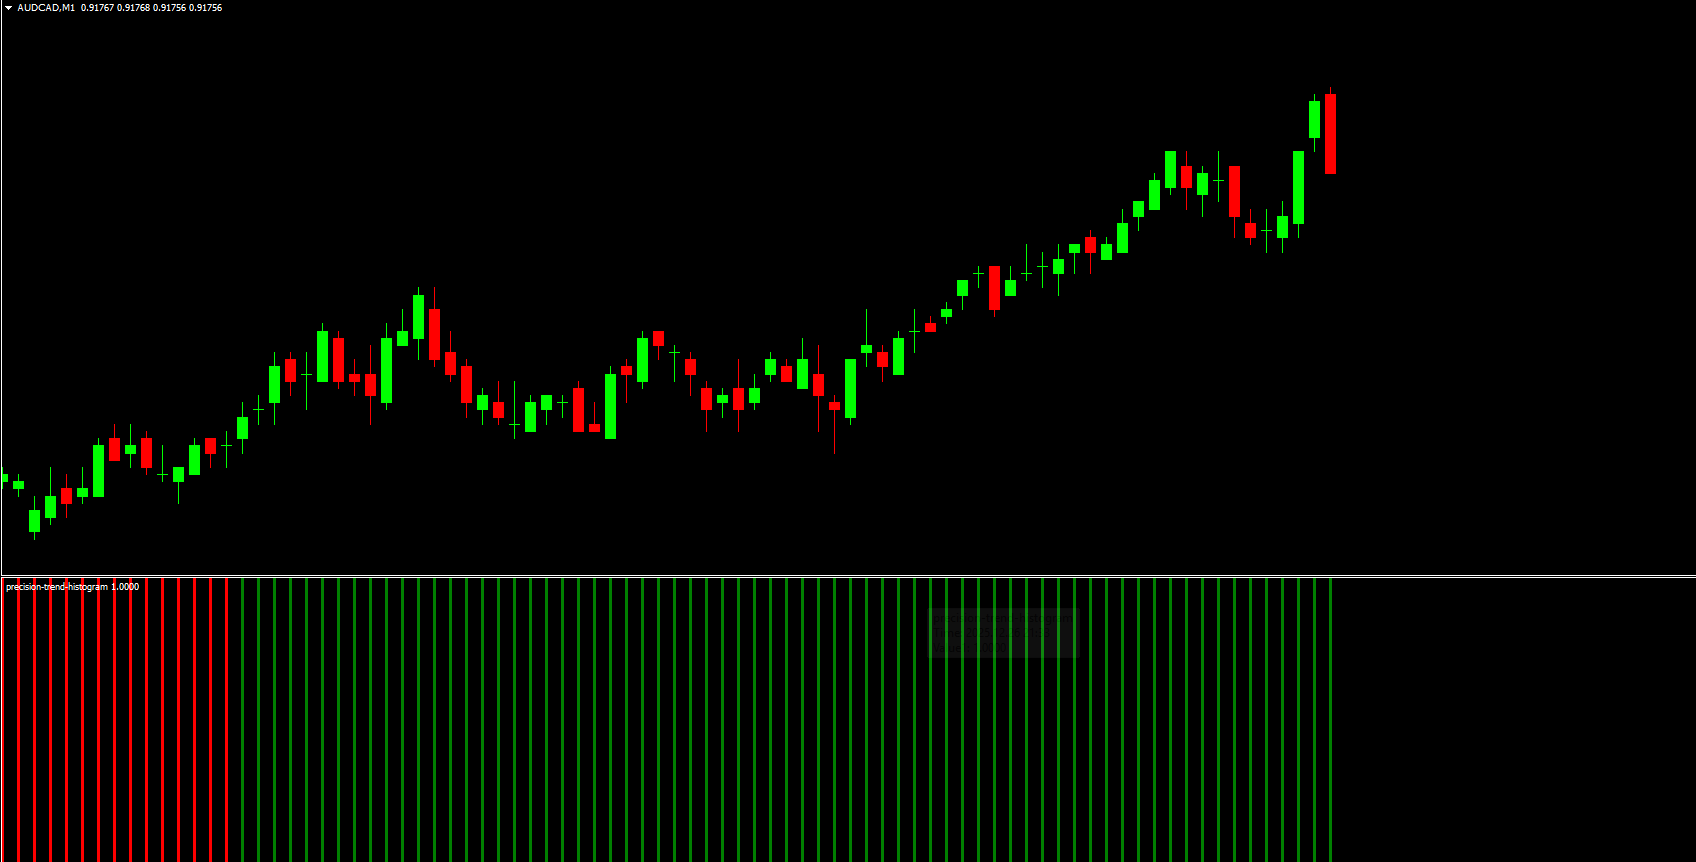
The Precision Trend Histogram Indicator analyzes market price data and represents trend direction using colored histogram bars displayed in a separate indicator window.
Green histogram bars indicate bullish trend conditions
Red histogram bars indicate bearish trend conditions
This visual representation allows traders to quickly assess whether buyers or sellers are in control of the market. Because the indicator reacts sensitively to price movement, it can highlight early changes in trend momentum before they become obvious on price charts.
Identifying Trends with the Precision Trend Histogram Indicator
Accurate trend identification is one of the strongest features of the Precision Trend Histogram Indicator. Traders can easily follow the dominant market direction by observing the color and consistency of histogram bars.
When green bars appear consistently, the market is considered to be in an uptrend. Conversely, continuous red bars suggest a downtrend. This clarity helps traders avoid trading against the prevailing trend, which is one of the most common mistakes in Forex trading.
Trading Strategies Using the Precision Trend Histogram Indicator
Trend Continuation Strategy
One effective way to use the Precision Trend Histogram Indicator is to trade trend continuations. In an established uptrend, traders can wait for temporary pullbacks represented by red histogram bars. When the indicator switches back to green bars, it signals a potential buy entry in line with the prevailing trend.
The same concept applies to downtrends, where traders look for temporary green bars followed by a return to red bars for sell opportunities.
Entry Zone Identification Strategy
The Precision Trend Histogram Indicator can also help traders identify optimal entry zones. Instead of entering trades late, traders can wait for retracements and use the histogram color change as confirmation to join the trend at better price levels.
This strategy improves risk-to-reward ratios and reduces the likelihood of chasing price.
Trend Reversal Detection Strategy
Due to its high sensitivity, the Precision Trend Histogram Indicator can assist traders in spotting potential trend reversal zones. Rapid color changes or weakening histogram momentum may indicate that the current trend is losing strength.
Traders often combine these signals with Price Action patterns or support and resistance levels for confirmation before entering reversal trades.
Benefits of Using the Precision Trend Histogram Indicator
The Precision Trend Histogram Indicator offers several advantages that make it a valuable addition to any MT4 trading setup.
Accurate Trend Identification
The indicator provides precise trend direction readings, which can improve trading accuracy and overall success rates.
Trading Confluence
It works well as a confirmation tool when combined with price action, support and resistance, or other technical indicators.
User-Friendly Design
The clear histogram bars make it easy to interpret signals without cluttering the chart.
Versatile Trading Styles
The indicator supports Scalping, day trading, and swing trading across multiple timeframes.
Best Timeframes for the Precision Trend Histogram Indicator
The Precision Trend Histogram Indicator performs well across various timeframes:
Lower timeframes for scalping and intraday trading
Medium timeframes for day trading
Higher timeframes for swing trading and Trend Following
Higher timeframes generally offer stronger and more reliable signals, while lower timeframes provide more frequent trading opportunities.
Combining the Precision Trend Histogram Indicator with Other Tools
For best results, traders often combine the Precision Trend Histogram Indicator with:
Support and resistance analysis
Trendlines
Moving averages
Price action confirmation
You can find more professional MT4 indicators and trading tools on IndicatorForest.com, where traders can build complete and reliable Forex strategies.
Final Thoughts on the Precision Trend Histogram Indicator
The Precision Trend Histogram Indicator is a powerful and accurate trend-following tool for MT4 traders. Its ability to clearly display trend direction, identify entry zones, and highlight potential reversals makes it suitable for traders of all experience levels.
When used correctly and combined with proper risk management, this indicator can significantly improve trading decisions and market timing.
👉 Visit IndicatorForest.com to explore more high-quality MT4 indicators, Forex tools, and professional trading resources.
8 Downloads
Published:
Dec 27, 2025 12:24 PM
Category: