Maximize Trend Accuracy with the Advanced ADX Indicators for MT4
In technical analysis, trading with the dominant market trend is one of the most reliable ways to secure a statistical edge. However, many retail day traders fail because they struggle to answer a foundational question: is the market genuinely trending, or is it simply moving sideways in a choppy consolidation range? Attempting to apply trend-following strategies during an illiquid range leads to continuous whipsaws and rapid capital drawdowns. The Average Directional Index, originally engineered by legendary technician J. Welles Wilder, serves as the industry-standard tool to solve this exact problem. Modern ADX indicators for MetaTrader 4 (MT4) enhance this classic mathematical engine, giving you an advanced visual workspace to measure trend power and directional bias simultaneously.
Decoding the Mechanics of the Advanced ADX Dashboard
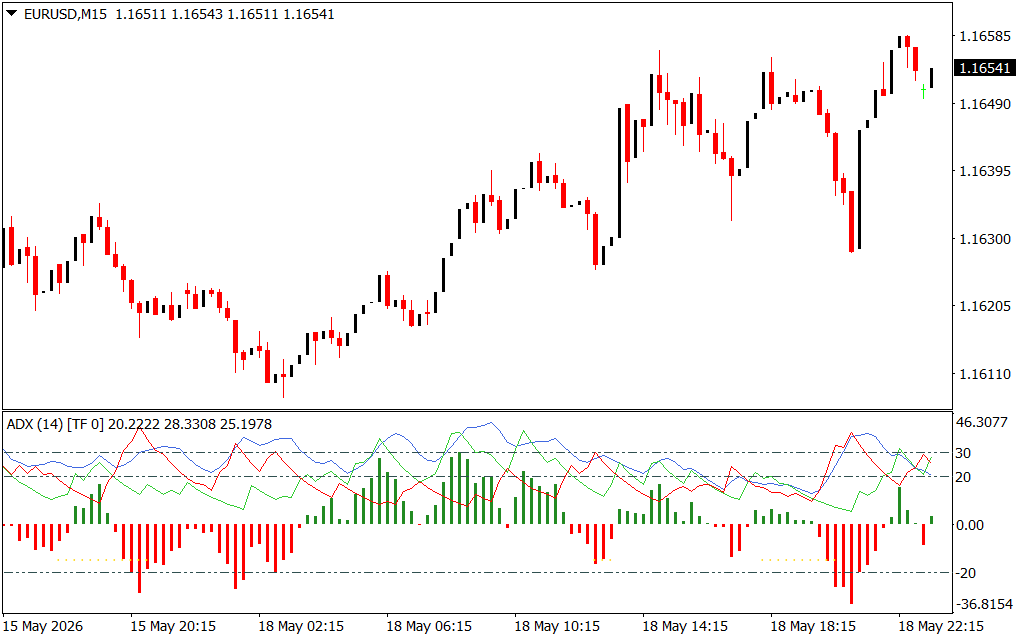
The advanced ADX indicators operate cleanly within a dedicated technical sub-window positioned immediately below your main price candlesticks. Rather than cluttering your chart layout with overlapping bands, this tool uses a smoothed mathematical matrix to separate price direction from absolute trend velocity.
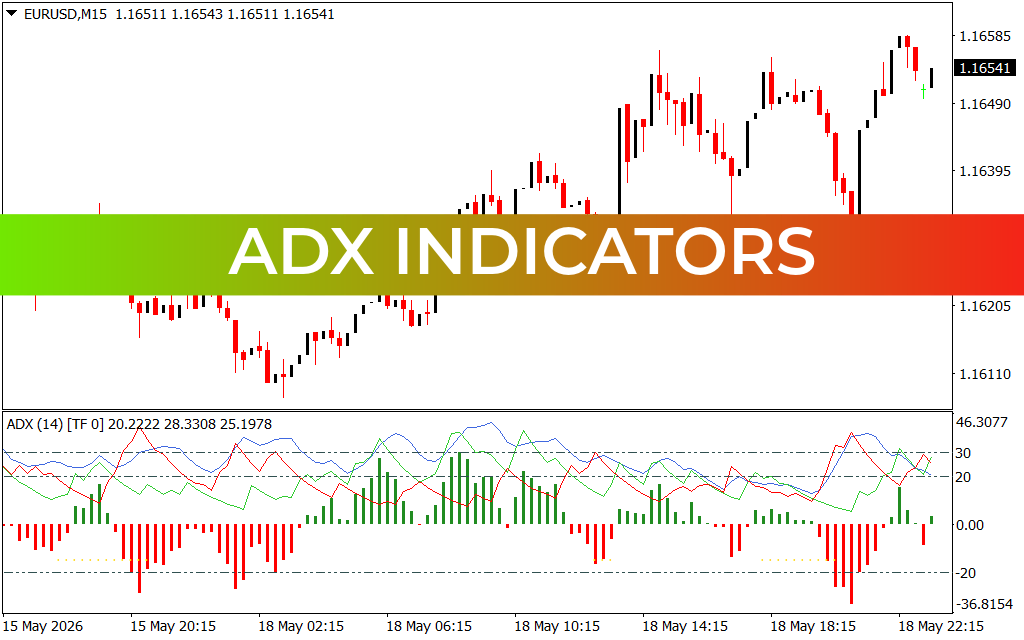
The software displays market data through three highly interactive visual components:
- The Main Green Signal Line: Represents the positive directional movement ($+DI$). When this line rises, it proves that buyers are actively controlling the immediate price structure.
- The Main Blue Signal Line: Represents the negative directional movement ($-DI$). A rise in this baseline alerts you that sellers are dominating the immediate order flow.
- The Dynamic Center Histogram (Green & Red): Plots the mathematical difference between the buyers and sellers relative to an equilibrium zero baseline. Bright green bars indicate expanding bullish expansion, while solid red bars flag aggressive institutional distribution.
As shown on the EURUSD chart, the tool features clear psychological boundary thresholds plotted at the 20.0 and 30.0 coordinates. These levels provide an immediate, objective framework for verifying when a quiet, sideways range has shifted into a high-probability institutional trend run.
Core Strategic Benefits for Volume and Momentum Traders
- Objective Volatility Filtering: By establishing strict line boundaries, the indicator prevents you from chasing false retail breakouts during dead, flat-line trading sessions.
- All-in-One Confluence Panel: It combines trend direction ($+DI/-DI$ crossovers) and Trend Strength into a single visual window, simplifying your technical routine.
- Universal Platform Compatibility: The calculation engine adapts seamlessly across all liquid financial assets, including Forex pairs, commodities, and index CFDs.
Practical Trading Rules and Execution Framework
To extract maximum consistency using the advanced ADX indicators on MT4, integrate these two core execution strategies:
- The Institutional Trend Expansion Entry: Monitor your asset on an intraday timeframe like the M15 chart. Watch for a crossover where the green line ($+DI$) moves cleanly above the blue line ($-DI$), accompanied by the histogram printing fresh green bars above the zero axis. To lock in validation, confirm that the main directional indicators have broken past the 20.0 volatility floor. Execute a buy order on the candle close, positioning a protective stop-loss underneath the local swing low.
- The Divergence Exhaustion Alert: When riding an extended trend, compare your Price Action peaks against the highs of the ADX lines. If price prints a fresh structural high but the indicator line fails to break its previous peak and hooks downward, it warns of an imminent momentum collapse—giving you a premium exit signal to lock in profits.
1 Download
Last Update:
May 19, 2026 02:38 AM
Published:
Jan 19, 2026 20:13 PM
Category: