Mastering Market Strength with the ADX Smoothed Vbob Indicator
In the fast-paced world of Forex and CFD trading, identifying whether a trend is gaining momentum or losing steam is the key to consistent profitability. While traditional trend-following tools often suffer from lag or generate false signals in volatile conditions, the ADX Smoothed Vbob indicator offers a distinct mathematical edge. By combining the classic Average Directional Index (ADX) with a proprietary smoothing algorithm, it filters out market noise and reveals the true strength of a market move.
The Science of Smoothed Momentum
The Average Directional Index (ADX) is widely used by professional traders to measure the strength of a trend regardless of its direction. However, in lower-timeframe trading, raw ADX lines can be jagged and difficult to read. The ADX Smoothed Vbob addresses this limitation by applying a secondary moving-average smoothing process to the calculations.
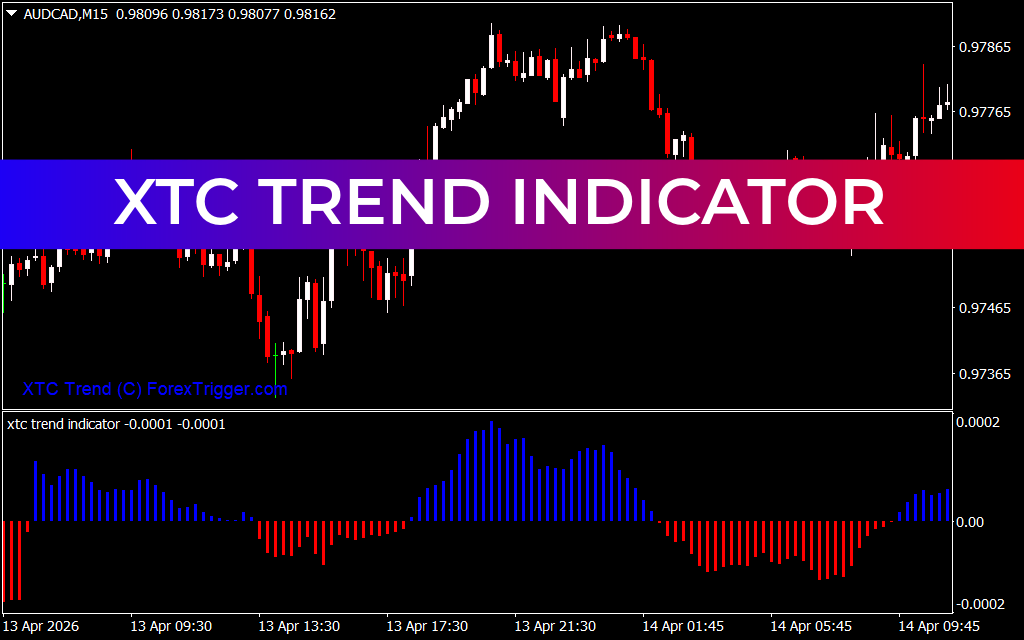
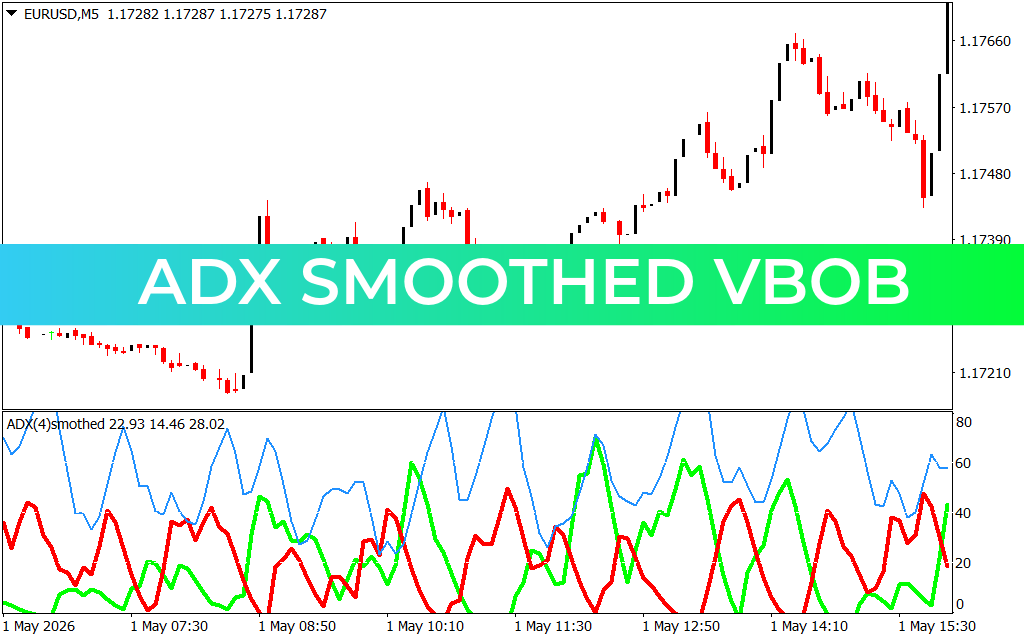
The output is presented as a clean, easy-to-read histogram in a separate sub-window:
- Blue Histogram Bars: When the bars are blue and rising above the zero line, it indicates that the directional strength of the market is accelerating. This is a clear signal that the underlying trend—whether bullish or bearish—is strong enough to support new positions.
- Orange Histogram Bars: A shift to orange warns traders that the momentum is fading and the market may be entering a consolidation or reversal phase.
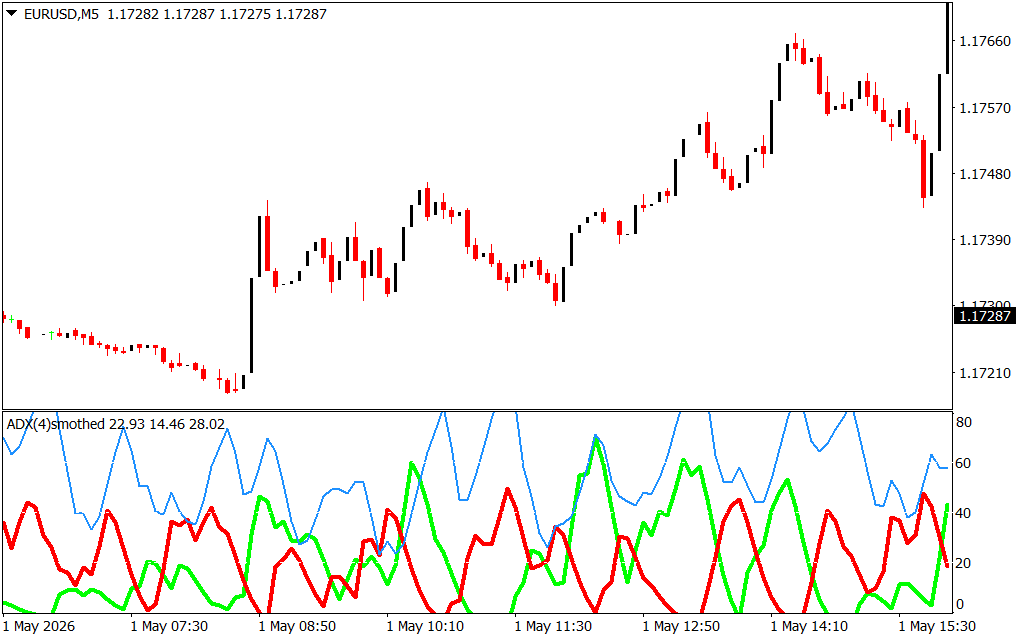
Strategic Advantages on the M5 Chart
As demonstrated in the EURUSDM5 chart, the ADX Smoothed Vbob excels in intraday trading environments. On a 5-minute timeframe, Price Action can be extremely erratic, with sudden spikes creating false breakouts.
By utilizing the smoothed histogram, day traders can avoid entering trades during weak, low-conviction moves. Notice how the histogram shifts to blue during the extended impulse wave, allowing traders to stay in the move and maximize their risk-to-reward ratio. When the momentum exhausts, the bars turn orange, providing an objective signal to lock in profits before the trend retraces.
Integrating the ADX Smoothed Vbob into Your Strategy
To achieve long-term success, the indicator should be used to confirm your primary technical analysis:
- Trend Confirmation: Only take trades in the direction of the market when the ADX Smoothed Vbob is displaying blue bars.
- Filter Out Ranging Markets: If the histogram is flat and alternating colors frequently, it indicates that the market lacks a clear directional trend. Standing aside during these periods protects your capital.
- Divergence Signals: Watch for instances where the price makes a new high while the indicator's peaks begin to decline. This divergence is a classic warning sign that a trend is exhausting.
By transforming complex data into a simple, color-coded visual format, the ADX Smoothed Vbob empowers traders to make disciplined, evidence-based decisions, ensuring that every trade is backed by true market momentum.
1 Download
Last Update:
May 04, 2026 10:48 AM
Published:
Jan 28, 2026 16:48 PM
Category: