Master Mechanical Trendlines with the Demark Trend Indicator
In traditional technical analysis, drawing trendlines is often treated more as subjective art than rigid science. One trader might connect extreme candlestick wicks, while another cuts through price bodies, leading to inconsistent charting and execution errors. To establish statistical consistency across volatile sessions, professional day traders and swing traders rely on objective algorithmic parameters. The Demark Trend Indicator solves this common structural issue by implementing the rule-based logic developed by market pioneer Tom DeMark to identify valid, mathematically sound trendlines.
By automating pattern recognition directly on your MetaTrader terminal, this utility provides an unshakeable framework for identifying true Market Structure breakouts.
The Mathematical Rigor of DeMark Pivot Points
Standard trendlines frequently fail because they are drawn across arbitrary market peaks. The Demark Trend Indicator eliminates this issue by scanning your charts for specific structural patterns known as Tom DeMark (TD) Points. To establish a true supply or demand line, the software continuously filters price data through precise, multi-bar calculations.
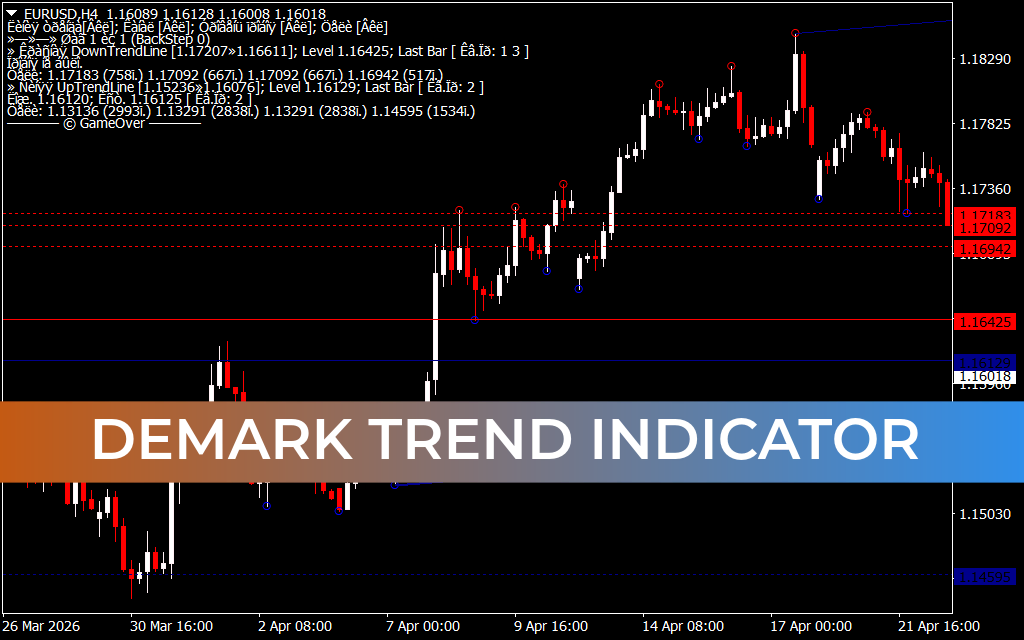
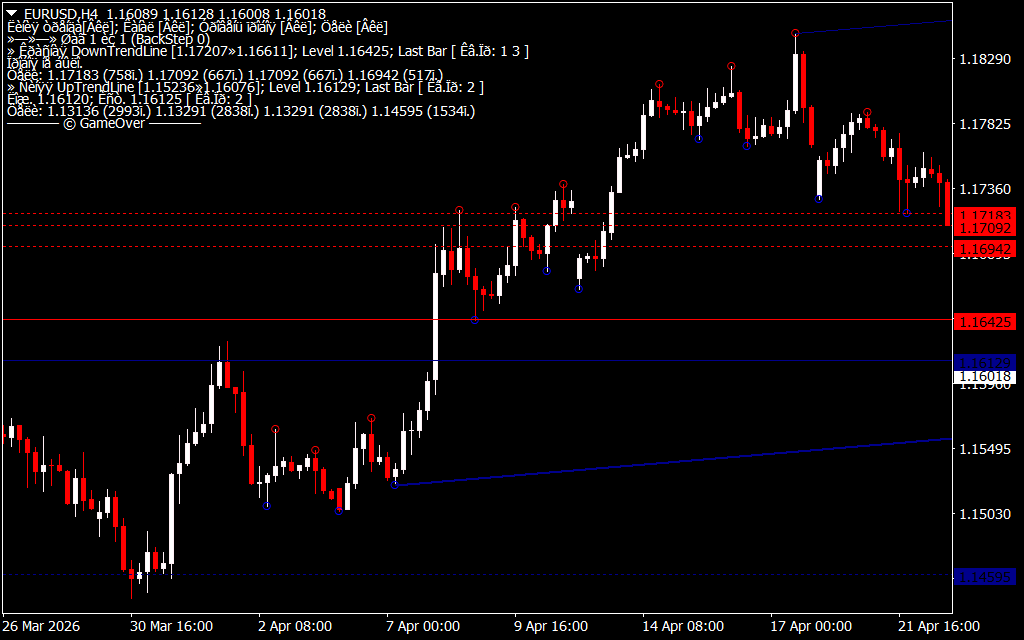
As displayed on the 4-hour ($H4$) EUR/USD workspace, the indicator removes human charting bias by deploying an automated structural layout:
- The TD Supply Line (Upper Resistance Line): The software automatically plots a downward-sloping blue resistance vector across verified TD Highs. This boundary marks the precise mechanical ceiling where institutional distribution is actively matching demand.
- The TD Demand Line (Lower Support Line): Conversely, a rising blue support vector connects key TD Lows. This line defines an active accumulation floor, providing day traders with a visual anchor for building low-risk long positions.
- Objective High-Low Highlight Points: The script overlays clear red circular markers above peak swing highs and blue circular rings below major swing troughs. These clear visual indicators isolate the exact technical anchors validating each dynamic boundary.
Executing High-Probability Breakout Strategies
Integrating the mechanical rules of the Demark Trend Indicator into your execution loop creates a highly disciplined, systematic approach to navigating trend transitions.
1. Trading the True Structural Breakout
The primary strategy revolves around trading definitive structural line breaches. When a candlestick closes completely outside the dynamic blue resistance or support vectors, it marks an official invalidation of the previous consolidation phase. For example, a decisive bullish candle close above the upper TD Supply Line alerts the technical analyst that institutional buying has returned, offering an optimal entry to ride the emerging upward leg.
2. Managing Risk via Pivot Invalidation
Managing stop-losses with subjective trendlines often results in premature exits or catastrophic lag. The Demark Trend Indicator resolves this challenge by providing clear, geometric invalidation levels. If you enter a long position on an upward breakout, the opposing recent TD Low (marked by the blue circle) serves as a logical, rules-based area for placing a protective stop-loss.
Conclusion
The Demark Trend Indicator is an essential workspace upgrade for any technical trader committed to systematic Price Action analysis. By replacing manual line placement with objective math, it ensures you remain aligned with verified institutional pivot points. Download the Demark Trend Indicator today to upgrade your MetaTrader workspace and trade breakouts with clinical precision.
6 Downloads
Last Update:
May 20, 2026 02:08 AM
Published:
Jan 19, 2026 07:49 AM
Category: