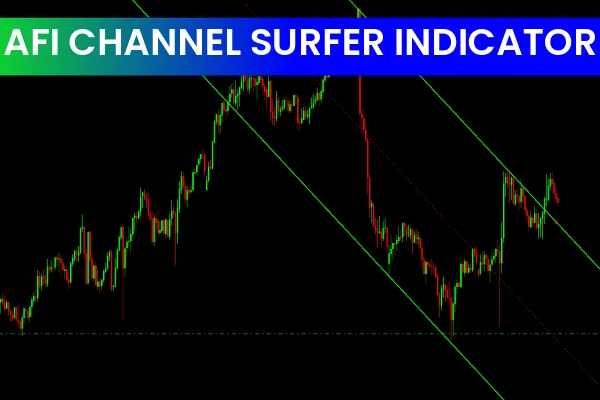
The AFI Channel Surfer Indicator for MT4 is a powerful tool for traders who want to identify potential trendline Support And Resistance levels on MTF charts. This automatic price channel indicator helps you spot breakouts and reversals, making it a valuable addition to any trading strategy.
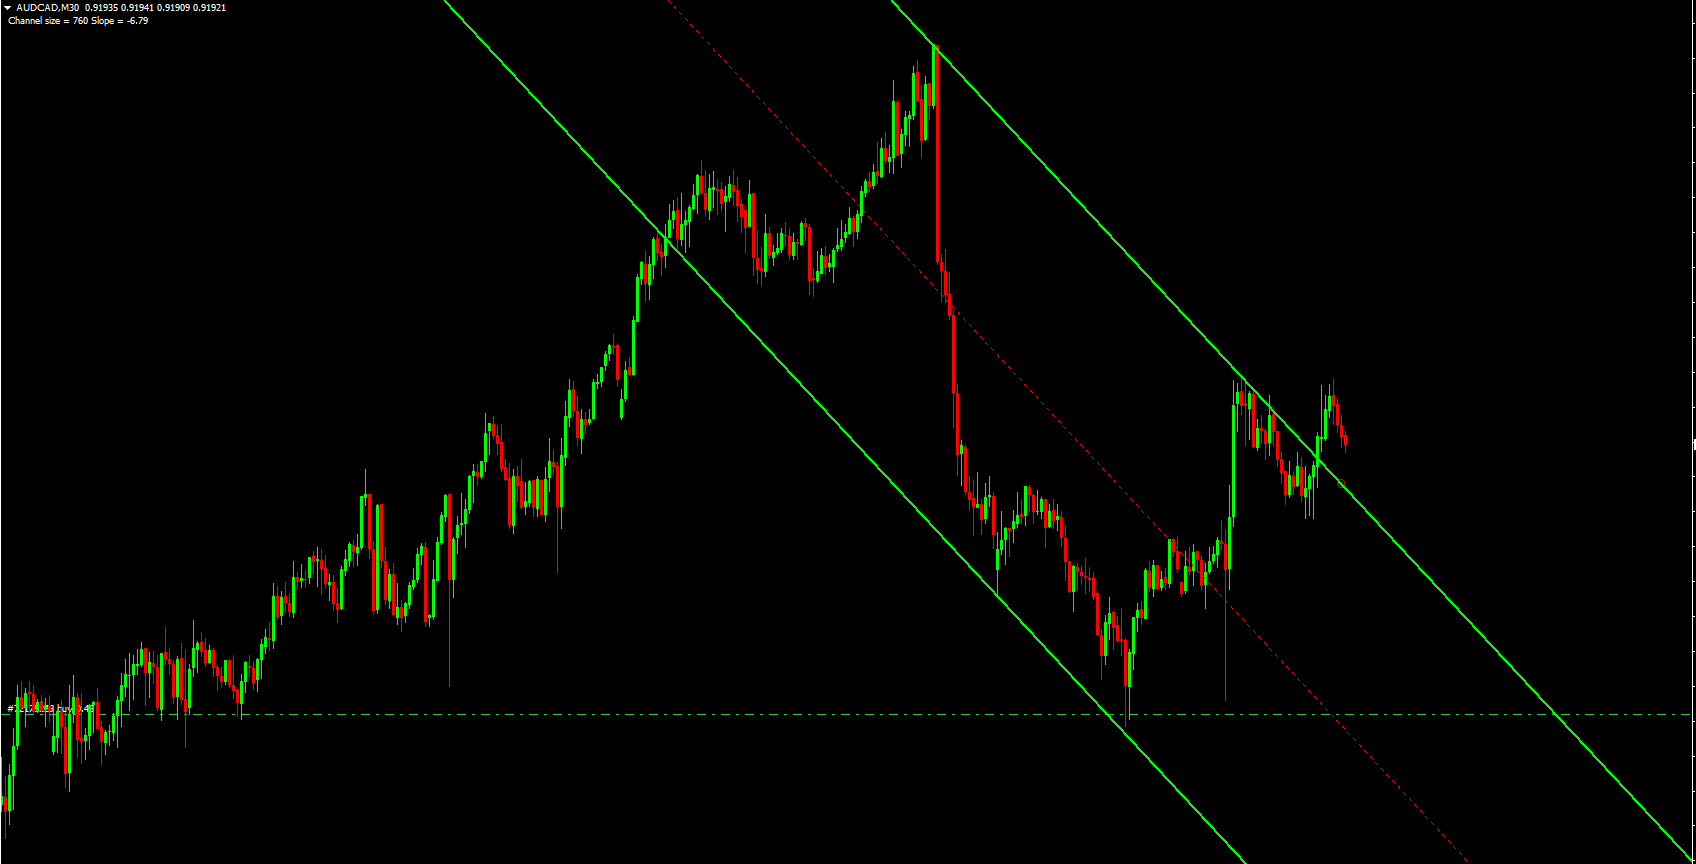
A price channel consists of two parallel trendlines that can be vertical, descending, or horizontal. A breakout occurs when the price crosses and stays above a trendline representing either support or resistance. Using the AFI Channel Surfer Indicator, traders can easily recognize these breakout points and anticipate future price movements.
Trading with the AFI Channel Surfer Indicator
When the price tests the upper trendline of the channel, it signals a potential sell opportunity. Conversely, when the price approaches the lower trendline, it indicates a potential buy opportunity. Traders should also incorporate Price Action signals to confirm entries and improve accuracy.
A rebound from the channel’s support or resistance often indicates a Trend Reversal. For example, if the price fails to exceed the trendline resistance after a bullish run, it may signal a bearish reversal. Similarly, if the price holds at the lower trendline, it may indicate a continuation of the bullish trend.
This indicator also helps project potential price targets during trending markets. Buying near the channel support allows traders to plan exits at the channel resistance, optimizing risk-reward ratios and making trading more strategic.
Benefits of the AFI Channel Surfer Indicator
Identifies key trendline support and resistance levels automatically
Signals potential breakouts for timely entries and exits
Useful for day trading, intraday, and swing trading strategies
Compatible with MT4 and supports multi-timeframe (MTF) analysis
Helps plan trades with defined price targets and stop-loss levels
Conclusion
The AFI Channel Surfer Indicator is an essential tool for forex and stock traders focused on trendline support and resistance levels. By identifying bullish and bearish breakouts and outlining price retracements, it simplifies trade planning and enhances the effectiveness of price action strategies. Explore this indicator today at IndicatorForest.com to improve your trading strategy.
FAQ
Published:
Dec 09, 2025 13:50 PM
Category: