Mastering Momentum with the AIMS AO Bars Indicator
In the complex world of Forex trading, distinguishing between market noise and true directional momentum is the ultimate challenge. Traders often rely on a multitude of lagging indicators, resulting in "analysis paralysis" and missed opportunities. The AIMS AO Bars (Awesome Oscillator Bars) indicator offers a streamlined, professional solution by distilling price momentum into a simple, color-coded visual format. By focusing on the velocity of price movement rather than just the price itself, this tool provides a powerful edge for both scalpers and swing traders.
What is the Awesome Oscillator?
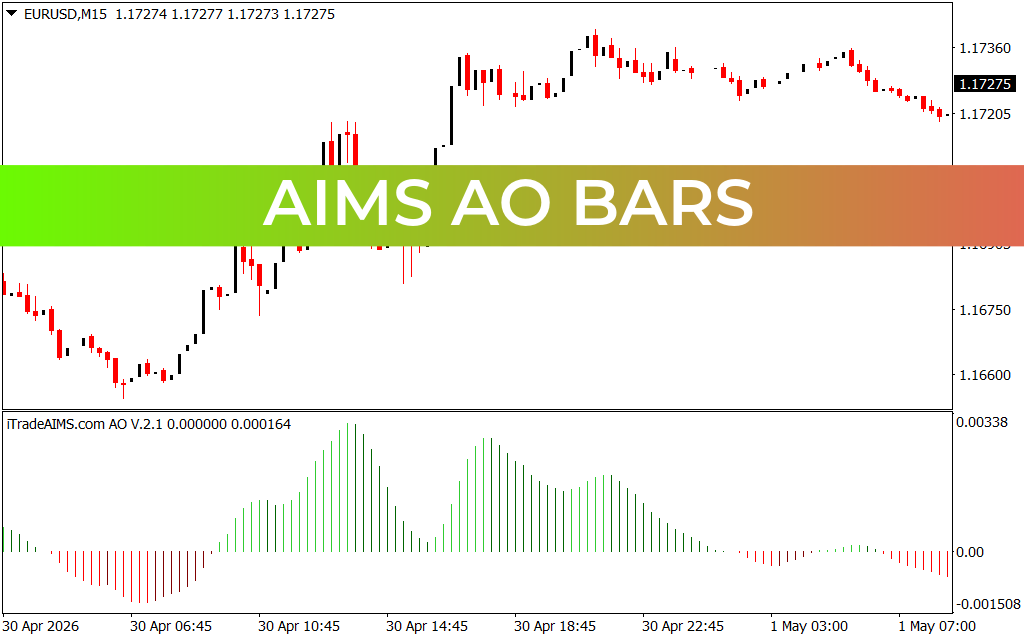
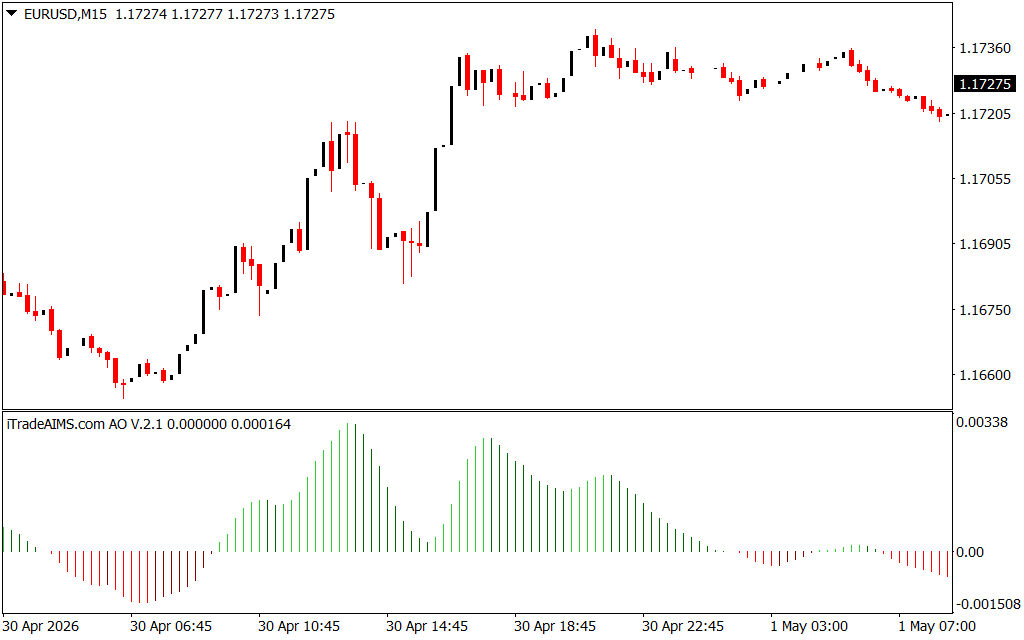
The Awesome Oscillator (AO) is a staple in technical analysis, designed to measure market momentum. It calculates the difference between a 34-period and a 5-period Simple Moving Average (SMA), plotted over the central points of the bars. The AIMS AO Bars enhances this classic indicator by presenting the data as a clean, easy-to-read histogram.
- Green Histogram Bars: These signify bullish momentum. When the bars are green and rising above the zero line, buying pressure is accelerating, signaling a strong environment for long positions.
- Red Histogram Bars: These indicate bearish momentum. When the bars flip to red and move below the zero line, selling pressure is dominant, providing a clear warning to exit long positions or look for short opportunities.
Leveraging AIMS AO Bars for Precision
As demonstrated in the EURUSD M15 chart, the AIMS AO Bars indicator is exceptionally effective at filtering out the erratic "whipsaw" movements common in lower-timeframe trading. On the 15-minute chart, Price Action can often be misleading, with minor pullbacks creating false reversal signals.
The AIMS AO Bars act as a "truth filter." By requiring the histogram to shift color before confirming a trend, the indicator ensures you only engage with the market when there is genuine conviction behind the move. For instance, notice how the indicator remained a solid green during the extended upward impulse, allowing traders to hold positions with confidence. Conversely, the transition to red provides an objective, data-driven exit point, preventing traders from holding onto losing trades during a Trend Reversal.
Strategic Integration
To get the most out of the AIMS AO Bars, it should be integrated into a robust trading strategy rather than used in isolation:
- Zero-Line Crossovers: The most robust signal is the transition across the zero line. A cross from red to green is a powerful buy signal; a cross from green to red is a high-probability sell signal.
- Trend Continuation: In a clear uptrend, look for the histogram to turn green, pull back slightly (but stay above the zero line), and then turn green again. This "re-entry" signal is excellent for adding to winning positions.
- Divergence: Watch for price making a new high while the AO histogram makes a lower peak. This divergence suggests the current momentum is exhausted, warning of a potential trend change.
By simplifying complex momentum data, the AIMS AO Bars indicator enables traders to make disciplined, evidence-based decisions, ensuring that every trade is backed by the current market momentum.
1 Download
Last Update:
May 04, 2026 10:17 AM
Published:
Jan 28, 2026 17:38 PM
Category: