The Nice Value Chart 1.0 Indicator is a popular and free Forex indicator for the MT4 platform. It helps traders analyze market movements and make informed trading decisions by highlighting key Support And Resistance levels. The indicator works by plotting a chart of price action over time and calculating the average price along with the standard deviation.
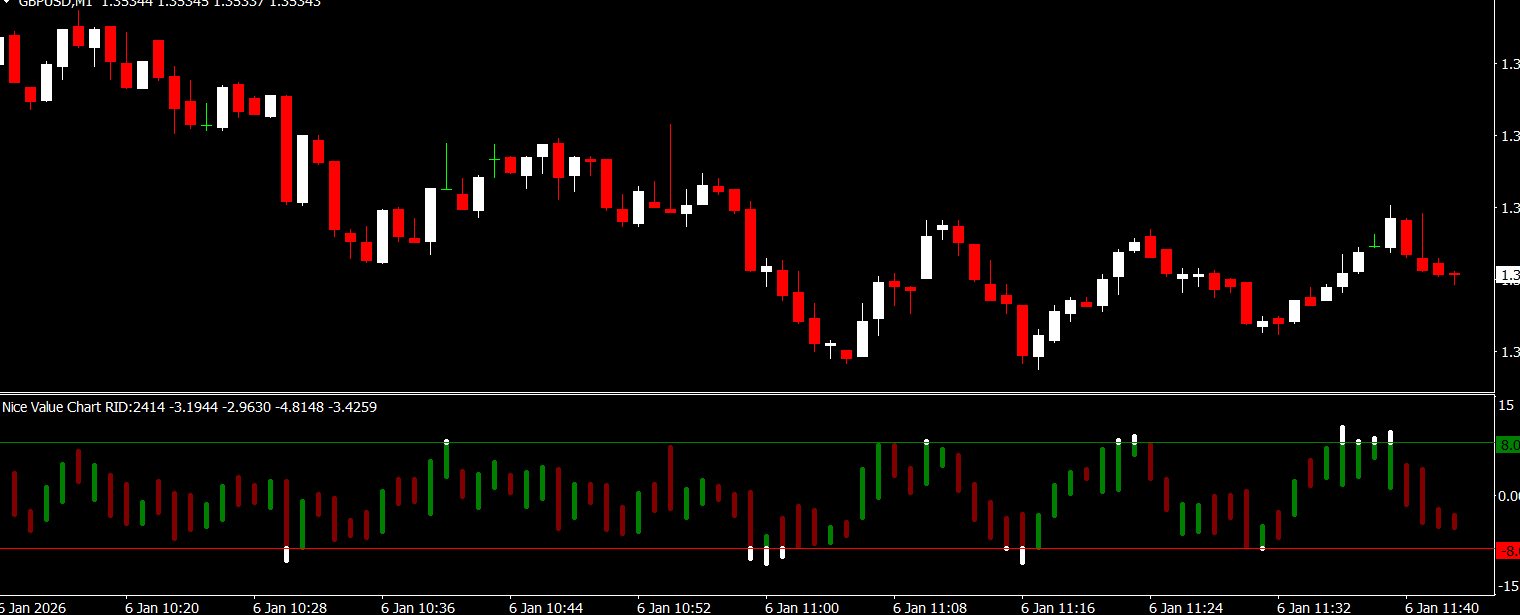
By plotting these values as lines on the chart, traders can easily identify potential entry and exit points. This simplifies the process of spotting important price levels, which can significantly improve trading decisions. The Nice Value Chart 1.0 Indicator is designed for both beginners and experienced traders who want a clear visual representation of market trends.
Why Use the Nice Value Chart 1.0 Indicator
Identify Support and Resistance Levels
Support and resistance are critical in Forex trading. The Nice Value Chart 1.0 Indicator calculates average price and standard deviation to provide clear visual lines that indicate where the market may reverse or continue.
Simplified Market Analysis
The indicator makes it easy to understand market conditions without relying on complex calculations. By analyzing the plotted lines, traders can make faster and more accurate decisions.
Customizable and User-Friendly
Traders can quickly set up the indicator on any MT4 chart by selecting the currency pair, timeframe, and analysis period. The lines are automatically plotted, making it accessible for all skill levels.
Benefits for Forex Traders
Better Entry and Exit Points
By identifying support and resistance levels, traders can determine optimal entry and exit points, minimizing risk and maximizing profits.
Enhanced Strategy Development
The Nice Value Chart 1.0 Indicator complements other technical tools, helping traders build more reliable strategies based on market structure.
Time-Saving Tool
With its simple setup and automatic calculations, traders can focus on making decisions rather than performing manual analysis.
Tips for Maximizing the Nice Value Chart 1.0 Indicator trend
Combine with Trend Indicators
Pairing the indicator with trend or momentum tools can confirm potential reversals and improve trade accuracy.
Adjust Timeframes Strategically
Use higher timeframes to identify major support and resistance, and lower timeframes for intraday trading decisions.
Monitor Market Volatility
High volatility periods may lead to temporary breaks of support or resistance lines. Always confirm signals with Price Action.
Conclusion
The Nice Value Chart 1.0 Indicator is an essential MT4 tool for Forex traders looking to analyze market support and resistance. Its easy-to-use interface, automatic plotting, and clear visual representation of average price and standard deviation lines make it ideal for improving trading decisions.
Visit IndicatorForest.com to download the Nice Value Chart 1.0 Indicator and enhance your Forex trading strategy today.
Published:
Jan 06, 2026 15:46 PM
Category: