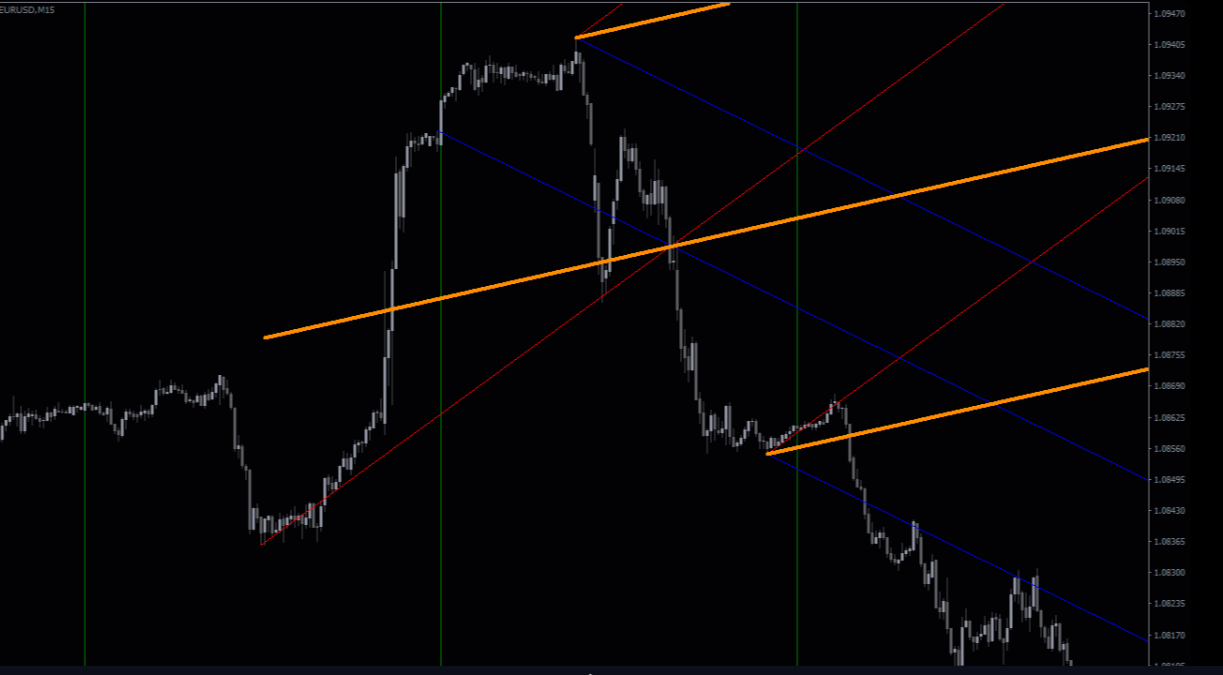
The All Averages v2.5 Distance Indicator is a powerful and practical forex trading tool designed for the MetaTrader 4 (MT4) platform. This free indicator helps traders analyze market trends by displaying the distance between multiple Exponential Moving Averages (EMA). By visualizing how far moving averages are from each other, traders can better understand Trend Strength and market momentum.
The All Averages v2.5 Distance Indicator MT4 is widely used by traders who rely on trend confirmation and moving average strategies. Its simple setup, accurate calculations, and clear visual output make it suitable for both beginner and experienced forex traders.
How the All Averages v2.5 Distance Indicator Works
The indicator calculates the distance between EMAs of different periods and displays the results directly on the chart or in a separate indicator window. These distances help traders determine whether the market is trending strongly or moving sideways.
Core Calculation Logic
Measures the gap between short-term and long-term EMAs
Evaluates momentum strength using EMA separation
Highlights trend expansion and contraction phases
When the distance between moving averages increases, it often signals a strong trend. When the distance narrows, it may indicate consolidation or a possible Trend Reversal.
Key Features of All Averages v2.5 Distance Indicator
EMA Distance Measurement
The indicator focuses on the distance between multiple exponential moving averages, providing a deeper understanding of trend dynamics beyond simple crossover signals.
Trend Confirmation Tool
Traders use the All Averages v2.5 Distance Indicator MT4 to confirm:
Strong bullish or bearish trends
Weak or ranging market conditions
Potential trend exhaustion
Multi-Timeframe Compatibility
This indicator works smoothly on all MT4 timeframes, making it ideal for:
Scalping strategies
Intraday trading
Swing and long-term trading
User-Friendly Interface
The indicator is easy to install and requires minimal configuration. Default settings work well, while advanced users can customize EMA periods to suit their strategy.
How to Use All Averages v2.5 Distance Indicator in Trading
Trend Strength Strategy
Look for increasing EMA distance to confirm strong trends
Avoid trades when EMA distances are small and flat
Trade in the direction of the dominant trend
Entry and Exit Support
The indicator works best when combined with:
Price Action analysis
Support And Resistance levels
Candlestick confirmation
Using the EMA distance as confirmation helps improve timing and trade accuracy.
Risk Management
Always apply stop-loss and take-profit levels. The All Averages v2.5 Distance Indicator MT4 should be used as part of a complete trading plan, not as a standalone signal generator.
Advantages of All Averages v2.5 Distance Indicator
Free to use on MT4
Accurate EMA distance calculations
Helps identify strong and weak trends
Suitable for multiple trading styles
Complements moving average strategies
These advantages make the indicator a valuable addition to any forex trading setup.
Who Should Use This Indicator
The All Averages v2.5 Distance Indicator MT4 is ideal for:
Trend-following traders
Traders using moving average systems
Beginners learning market structure
Advanced traders seeking confirmation tools
Its flexibility allows it to adapt to various market conditions.
Final Thoughts
The All Averages v2.5 Distance Indicator MT4 is a reliable and informative forex indicator that helps traders visualize trend strength through EMA distance analysis. By offering clear insights into market momentum, it supports better trading decisions and improved strategy execution.
👉 Visit IndicatorForest.com to download this indicator and explore more professional MT4 forex indicators.
FAQ
It calculates and displays the distance between multiple exponential moving averages, showing how far short‑term averages are from longer‑term ones. This distance reflects trend strength and expansion or contraction phases.
When distances between EMAs widen, it usually means the trend is strong and momentum is building. When the gaps shrink, it often signals consolidation, loss of momentum or a possible trend change.
You might favor new entries when EMA distances are increasing in the direction of your trade and be more cautious or take profits when distances start to contract. This keeps you aligned with strong phases and wary of fading trends.
It can be used on any timeframe, but many traders find it most useful on H1 and H4 where trends are clearer. Lower timeframes can change distance readings very quickly.
Price action, horizontal levels and oscillators like RSI help interpret whether a strong distance reading is a continuation setup or nearing exhaustion. Combined analysis tends to be more robust.
4 Downloads
Published:
Dec 18, 2025 01:54 AM
Category: