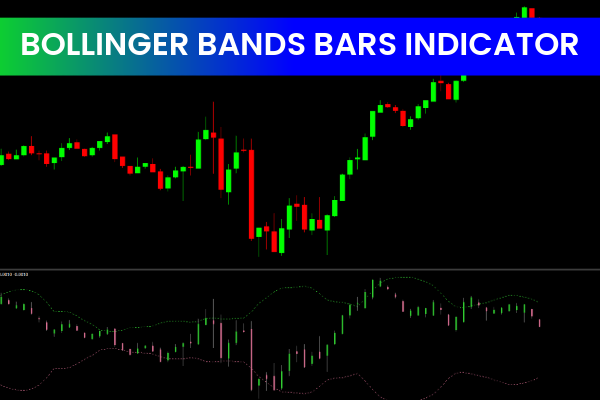
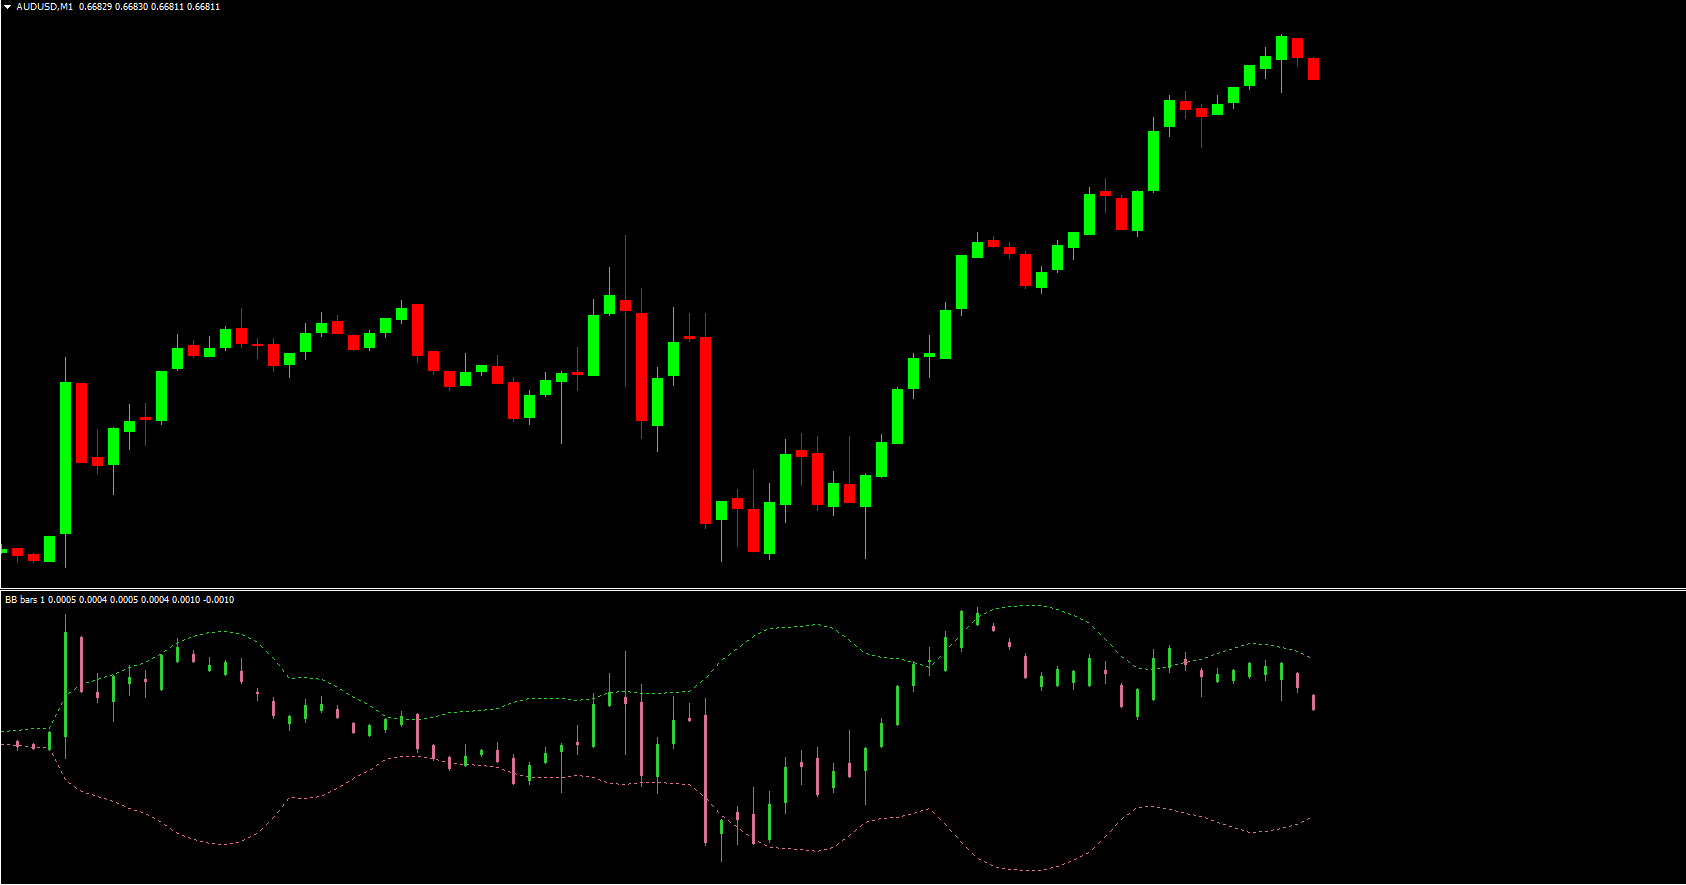
The Bollinger Band Bars indicator for MT4 displays a compact, mini price chart with Bollinger Bands in a separate indicator window. This allows traders to keep the main chart clean for other technical tools, making it ideal for traders who rely on confluence-based trading.
This indicator is suitable for beginners and advanced forex traders, and it performs well across all intraday charts as well as higher time frames. Bollinger Bands also play a central role in many automated trading strategies, making this indicator useful for both manual and algorithmic traders.
Bollinger Band Bars Indicator – Trading Signals
The indicator plots:
Upper Bollinger Band – Green
Lower Bollinger Band – Red
Bullish candles – Green
Bearish candles – Red
Trading signals follow the standard Bollinger Band rules, but traders can easily combine this indicator with additional tools such as RSI, MACD, moving averages, or price-action confirmations.
How Bollinger Bands Work
High volatility → Bands expand
Low volatility → Bands contract (squeeze), often signaling an upcoming breakout
Price tends to trade between the upper and lower bands
A band break often indicates continuation in that direction
Basic Trading Strategy
Buy Setup
Price touches or slightly pierces the lower band
A bullish reversal candle forms
Enter long
Stop loss: Below previous swing low
Take profit: Toward the opposite (upper) band
Sell Setup
Price touches or pierces the upper band
A bearish reversal candle forms
Enter short
Stop loss: Above previous swing high
Take profit: Toward the lower band
When to Use This Indicator
Ideal for traders who:
Want Bollinger Band signals without cluttering the main chart
Prefer confluence trading with multiple indicators
Use volatility-based strategies
Build automated MT4/MT5 systems
Conclusion
The Bollinger Band Bars indicator for MT4 offers a compact, easy-to-read visualization of Bollinger Bands in a separate window. It follows classical Bollinger Band trading principles and can be reinforced with other indicators for stronger confirmation. Its simplicity and versatility make it suitable for all types of forex traders—from newcomers to seasoned algorithmic traders.
FAQ
1 Download
Published:
Dec 10, 2025 15:23 PM
Category: