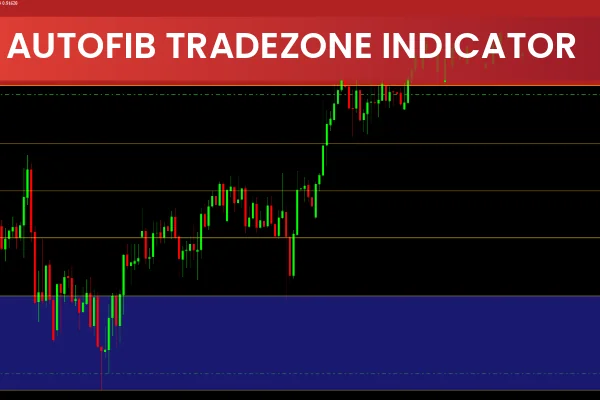
AutoFib TradeZones is an automatic Fibonacci-based price-level indicator for MetaTrader 4. It identifies meaningful retracement zones on the chart by automatically detecting the most recent swing high and swing low. Because Fibonacci tools are widely used across markets, this indicator works on all assets—forex, stocks, crypto, indices, and commodities.
It is suitable for traders of all styles: scalpers, intraday traders, swing traders, and trend followers.
How AutoFib TradeZones Works
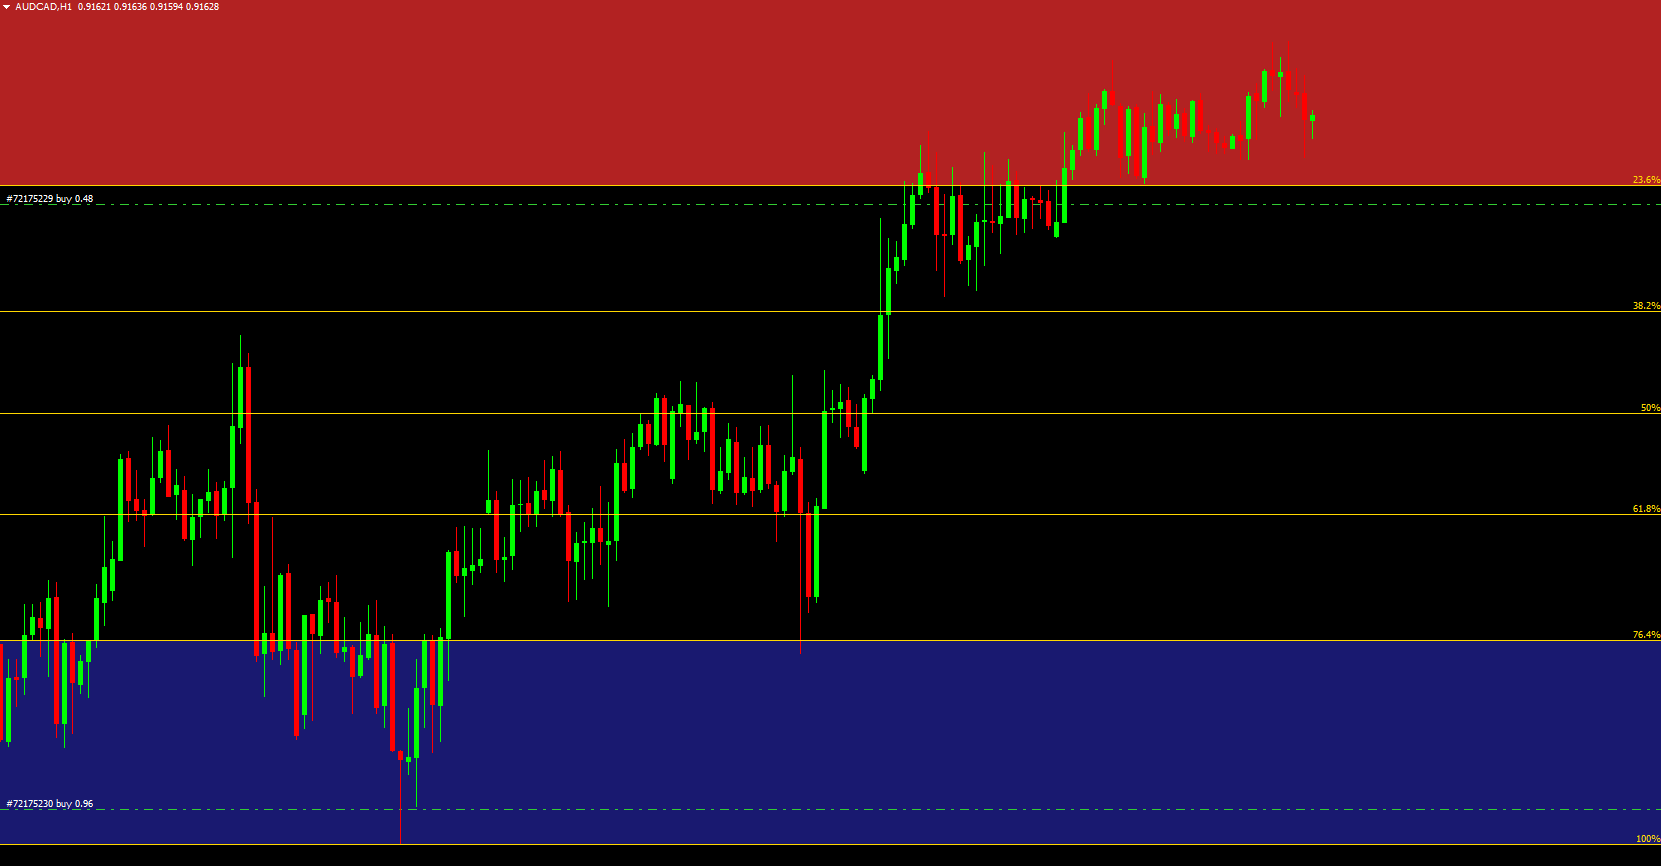
The indicator instantly plots the key Fibonacci retracement levels:
23.6% – 38.2% – 50% – 61.8% – 76.4% – 100%
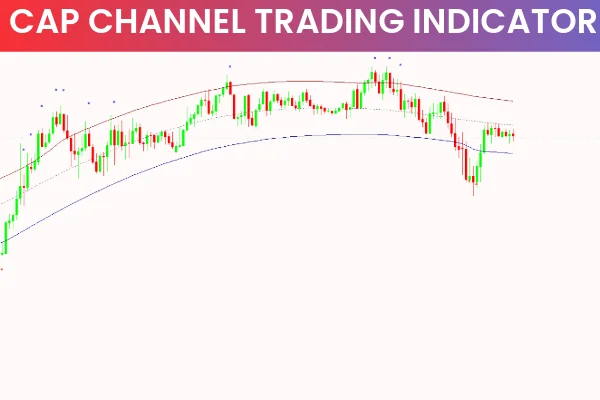
It also highlights two colored zones:
Blue Zone (bottom) → Ultimate Buy Zone
Red Zone (top) → Ultimate Sell Zone
These zones help traders quickly see where the market is likely to pull back before continuing its trend.
Reading Buy/Sell Signals
In an uptrend:
Price holding above the blue Buy Zone indicates trend strength.
Bullish candlestick patterns (like pin bars) rejecting any Fib level—such as 38.2% or 50%—signal potential continuation entries.
A failure to stay inside the red Sell Zone signals a buy exit.
In a downtrend:
Price holding below the red Sell Zone confirms bearish momentum.
Bearish rejections of Fib levels provide short-entry opportunities.
A breakout above the blue zone signals exiting shorts.
Stop-Loss Placement
Place stops around the nearest Fibonacci level below a buy entry or above a sell entry.
Why Traders Use It
Helps spot trend-pullback entries quickly
Suits all timeframes (1M to monthly)
Works with any instrument
Enhances price-action trading (especially with candlestick signals)
Includes an optional dynamic channel for additional support/resistance guidance
Conclusion
AutoFib TradeZones is a powerful automatic Fibonacci tool for MetaTrader 4. It simplifies identifying precise retracement-based entry and exit points and is especially valuable for traders who rely on Price Action. With its auto-plotting Fib zones and optional price channels, it can be an excellent addition to any MT4 trading strategy.
FAQ
10 Downloads
Published:
Nov 28, 2025 01:39 AM
Category: