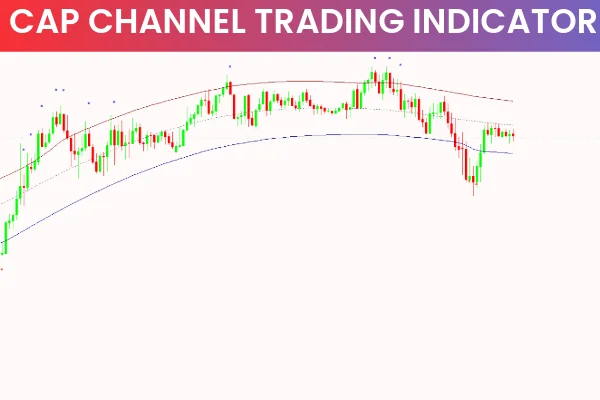
The CAP Channel Trading Indicator is designed for traders who use channel trading strategies. By plotting a price channel with upper and lower boundaries, this indicator helps identify overbought and oversold areas, making it easier to spot trading opportunities. The upper channel line signals potential reversals in overbought areas, while the lower line indicates potential reversals in oversold areas.
Because the indicator is volatility-sensitive, it adapts to price fluctuations and helps traders determine whether to enter, hold, or exit a trade. This makes it suitable for both short-term and long-term trading strategies across different currency pairs and instruments.
How the CAP Channel Indicator Works
The indicator uses an envelope-based approach, plotting two bands based on daily price volatility:
Upper channel line: Overbought area, signals potential sell opportunities
Lower channel line: Oversold area, signals potential buy opportunities
Additionally, the indicator posts arrow signals to indicate trend reversals, providing clear guidance for trade entries and exits.
Trade Entry and Exit Strategies
Buy Signal
Wait for the price to find support at the lower channel
Enter a trade when a red cross appears or at the close of a bullish candlestick
Place a stop loss below the recent swing low
Exit when the price reaches the upper channel line or a blue cross appears
Sell Signal
Wait for the price to find resistance at the upper channel
Enter a trade when a blue cross appears, indicating a market reversal
Place a stop loss above the recent swing high
Exit when the price reaches the lower channel line or a red cross appears
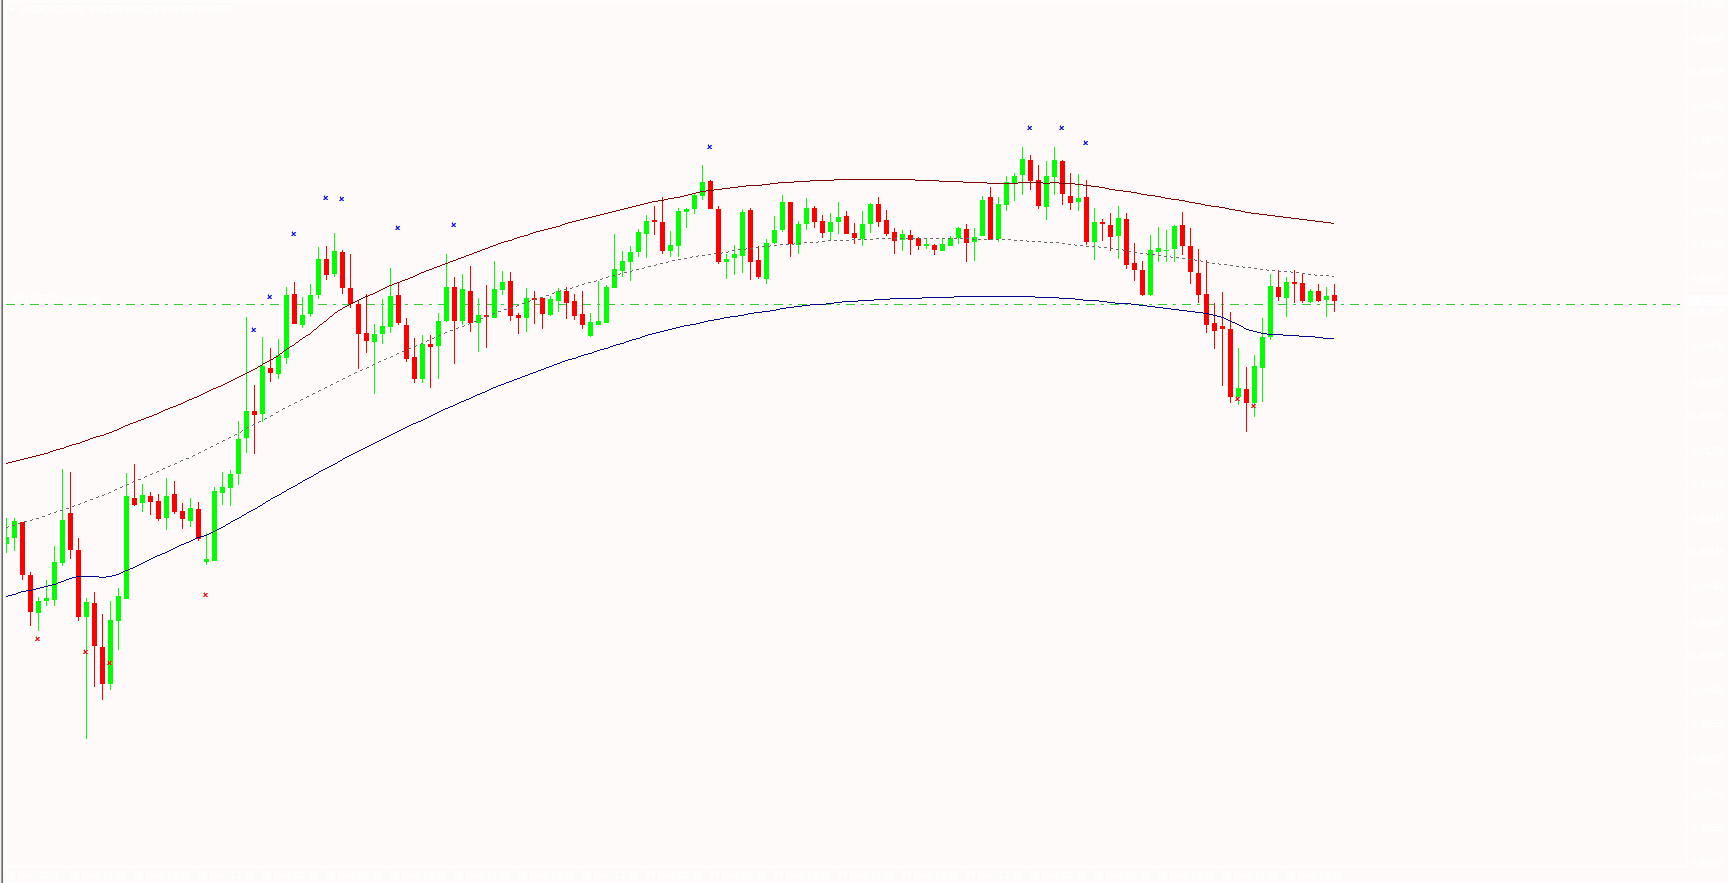
Real Market Example
On a Gold/USD chart, the CAP Channel indicator clearly shows how the price follows the upper and lower channel lines:
Red line: Overbought area; blue cross signals a sell opportunity
Blue line: Oversold area; red arrow signals a buy opportunity
Traders can follow these signals to enter trades at optimal points, maximize profits, and minimize risk.
Advantages of the CAP Channel Trading Indicator
Suitable for channel trading strategies
Volatility-sensitive, adapts to market conditions
Provides trend reversal signals for both buy and sell trades
Works on MT4 and MT5 across multiple timeframes
Useful for short-term Scalping or long-term position trading
By combining volatility analysis with channel strategy, this indicator simplifies trade entries and exits, making it ideal for traders at all skill levels.
Conclusion
The CAP Channel Trading Indicator is an essential tool for traders using channel strategies. By plotting dynamic upper and lower bands and providing arrow signals for trend reversals, it offers clear guidance for entries and exits. Whether you trade MT4 or MT5, this indicator helps maximize trading opportunities while managing risk effectively. To download and use the CAP Channel Trading Indicator, visit IndicatorForest.com today.
FAQ
3 Downloads
Published:
Nov 30, 2025 00:44 AM
Category: