The Logarithmic Rate Indicator for MT4 is a powerful technical analysis tool designed to help traders analyze exponential price movements and market momentum. By applying logarithmic scaling to price changes, this indicator provides a clearer view of trend strength and acceleration, allowing traders to make more informed decisions across different markets and timeframes.

Suitable for Forex, commodities, indices, and cryptocurrency trading, the Logarithmic Rate Indicator works effectively on multiple timeframes—from Scalping on M1 charts to swing trading on daily or weekly charts. Whether you are a beginner or a professional trader, this indicator offers insights into both short-term and long-term price behavior.
How the Logarithmic Rate Indicator Works
The Logarithmic Rate Indicator calculates the rate of price change using logarithmic scaling rather than linear differences. This allows traders to:
Detect accelerating trends that may not be visible on linear charts.
Spot early reversals by observing changes in momentum.
Compare price movements across different instruments with varying pip values.
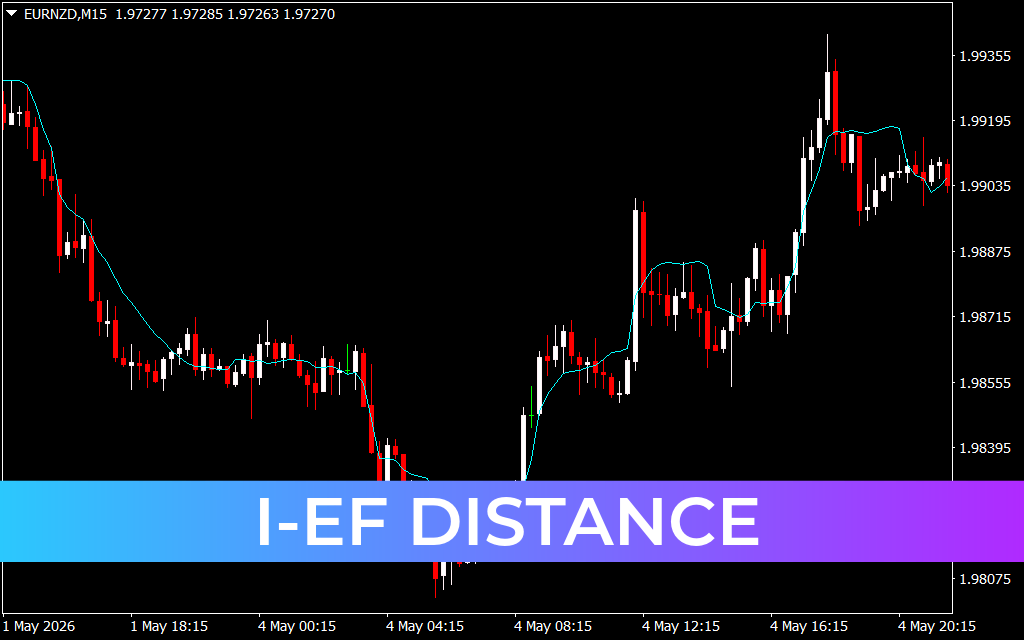
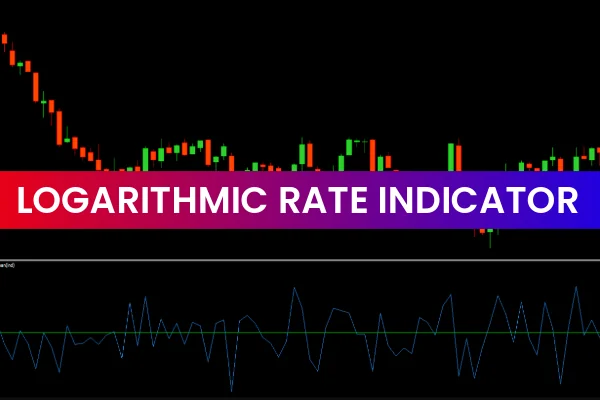
The indicator is usually displayed as a line graph or histogram below the price chart, giving a visual representation of the logarithmic rate of price movement. When the indicator rises, it indicates bullish momentum; when it falls, it signals bearish momentum.
Key Features and Benefits
✔ Exponential Trend Analysis
The logarithmic scale highlights the true rate of change, making Trend Strength more apparent than traditional linear methods.
✔ Early Reversal Detection
By tracking the acceleration or deceleration of price movements, traders can identify potential turning points before traditional indicators.
✔ Multi-Timeframe Compatibility
The Logarithmic Rate Indicator works on all MT4 timeframes, including M1, M15, H1, D1, and Weekly charts.
✔ Simple and Clear Visualization
The line or histogram display ensures that traders can quickly interpret market momentum without complicated calculations.
✔ Versatile Trading Applications
Ideal for scalping, day trading, swing trading, and long-term trend analysis across multiple financial instruments.
Practical Trading Applications
The Logarithmic Rate Indicator can be used alone or in combination with other tools for higher accuracy:
Trend Confirmation
Use the indicator to validate ongoing trends before entering trades based on moving averages or trendlines.
Reversal Signals
Look for divergence between the price and the logarithmic rate to anticipate market turning points.
Entry and Exit Timing
Use peaks and troughs in the indicator to time entries and exits more precisely.
Combine with Other Indicators
Pair the Logarithmic Rate Indicator with RSI, MACD, or Bollinger Bands to confirm momentum changes and strengthen trade signals.
By implementing these strategies, traders can make more objective decisions and reduce emotional trading mistakes.
Why Traders Prefer the Logarithmic Rate Indicator
Traders rely on the Logarithmic Rate Indicator because it offers a more accurate depiction of price momentum than linear methods. Its clear visual signals, multi-timeframe functionality, and adaptability make it a versatile tool for any trading strategy, from intraday scalping to long-term swing trading.
Conclusion
The Logarithmic Rate Indicator for MT4 is an essential tool for traders who want to analyze trend acceleration, detect momentum changes, and identify potential reversals. By providing a clear logarithmic view of Price Action, it enhances trading precision and decision-making.
👉 Download the Logarithmic Rate Indicator today from IndicatorForest.com and elevate your trading strategy with professional-grade analysis tools.
FAQ
4 Downloads
Published:
Dec 09, 2025 01:22 AM
Category: