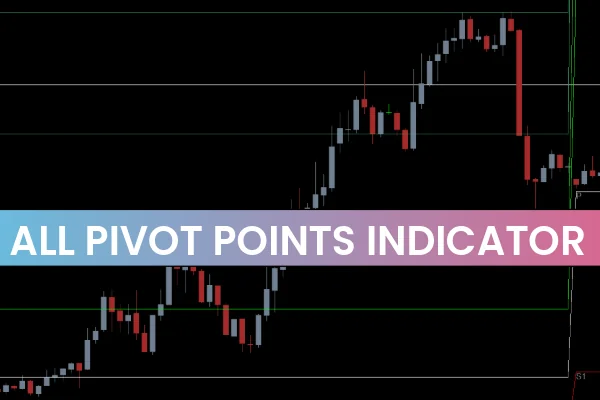
Pivot points are a cornerstone of technical analysis, helping traders identify key price levels where the market may reverse, break out, or continue trending. The All Pivot Points Indicator for MT4 is a price channel tool built for the Metatrader 4 platform that automatically calculates pivot points using historical price data such as the open, high, and close of each candle.
By plotting six key pivot levels—three support levels and three resistance levels—the indicator provides traders with a clear view of potential market reaction zones. These levels are updated automatically after the close of the New York trading session, ensuring that traders always have up-to-date pivot points.
How the All Pivot Points Indicator Works
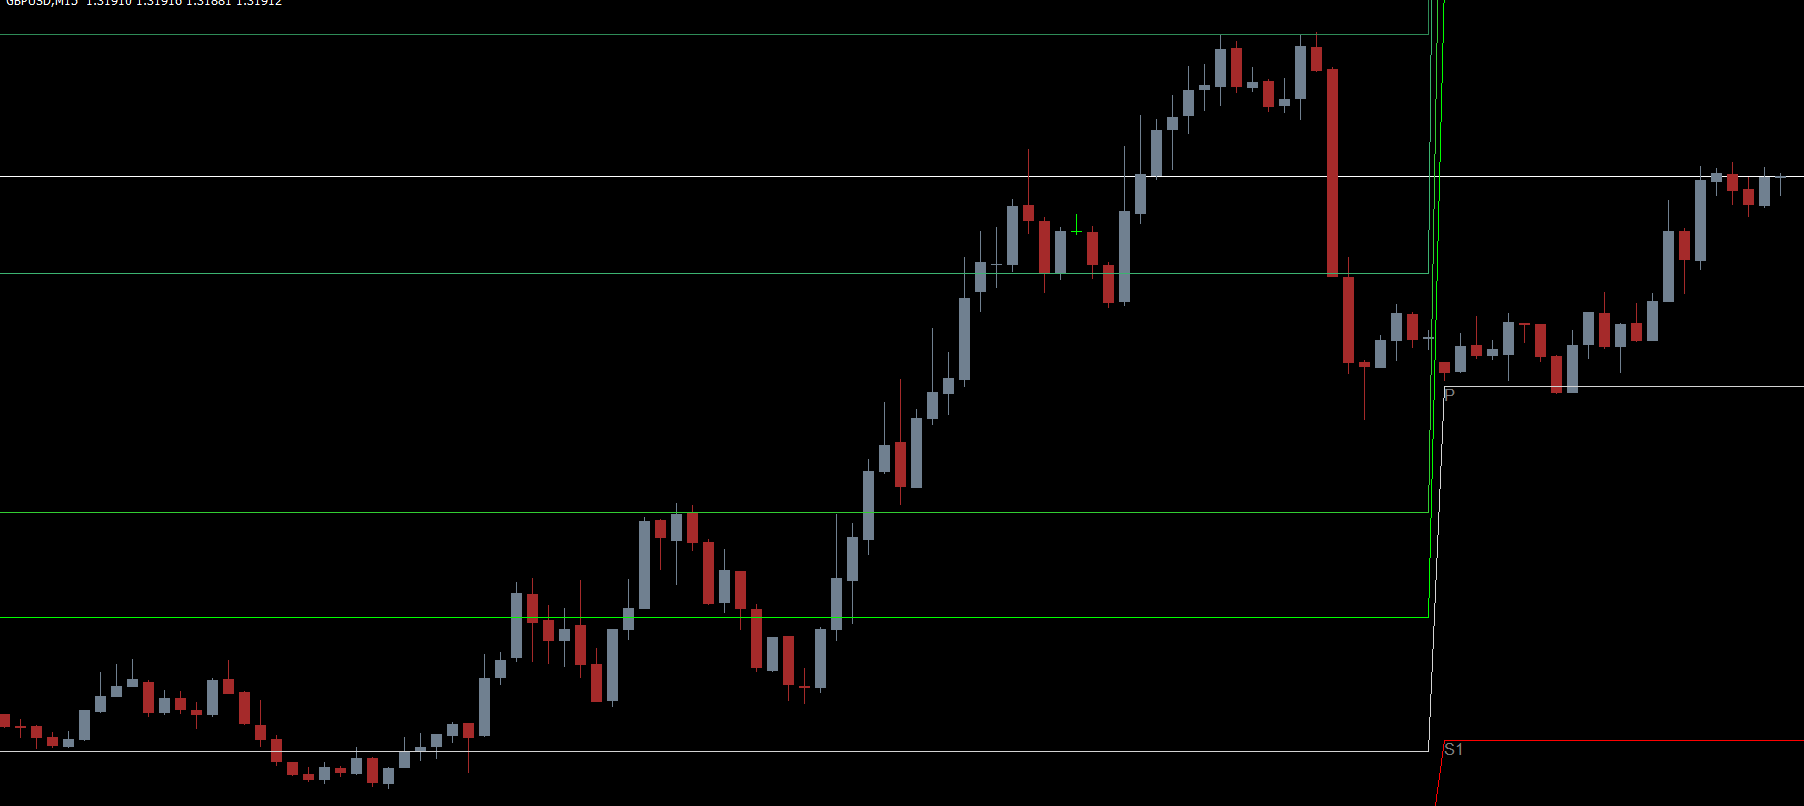
The All Pivot Points Indicator calculates pivot levels based on past Price Action and automatically plots horizontal lines on the main chart window:
Support Levels (S1, S2, S3): Represent potential price floors where buyers may step in.
Resistance Levels (R1, R2, R3): Represent potential ceilings where selling pressure may increase.
Traders can use these levels to anticipate market reactions, confirm trends, and spot breakout or reversal opportunities.
The indicator is compatible with MTF charts, meaning traders can customize the settings according to the timeframe they are analyzing. This flexibility makes it suitable for both intraday trading and long-term analysis.
How to Trade With All Pivot Points Indicator
After installing the indicator in MT4, the six pivot levels are automatically displayed on the chart:
Range-Bound Trading:
When the price fails to break a nearby resistance or support level, the market may be range-bound.
Traders can look for reversal candlestick patterns near pivot lines to enter short or long positions.
For example, if the price fails to break the nearest resistance, traders can consider sell opportunities, targeting support levels for profit-taking.
Breakout Trading:
When the price breaks a pivot support or resistance, it signals a possible Trend Continuation.
For example, a bullish breakout above the nearest pivot resistance may indicate a strong uptrend.
Traders can open a buy order at the breakout and target the next resistance level for taking profit.
Using pivot levels in combination with price action analysis, traders can improve trade accuracy and reduce false signals.
Benefits of Using the All Pivot Points Indicator
Automatically calculates and plots six key pivot levels.
Identifies Support And Resistance zones for breakout and reversal trades.
Updates pivot points daily, making it ideal for intraday trading.
Compatible with multiple timeframes and MT4 MTF charts.
Useful for both beginner and advanced traders using price action strategies.
Can be applied to forex and stock charts for versatile analysis.
By using the All Pivot Points Indicator, traders can confidently trade around key market levels, anticipate market reactions, and implement both trend-following and range-bound strategies.
Conclusion
The All Pivot Points Indicator for MT4 is an essential tool for traders looking to identify support and resistance levels, intraday breakout zones, and potential price reversal points. Suitable for beginners and experienced traders alike, this indicator simplifies pivot point analysis while enhancing trading accuracy.
Download the All Pivot Points Indicator for MT4 for free at IndicatorForest.com and start using accurate pivot levels to optimize your trading strategy.
FAQ
1 Download
Published:
Nov 25, 2025 22:28 PM
Category: