The AMKA indicator for MT5 is a powerful tool designed to help traders simplify their trading strategy. This indicator provides a comprehensive view of market trends and potential trading opportunities, making it an invaluable resource for traders of all levels.
What sets the AMKA Indicator MT5 apart is its adaptive moving average (AMA) feature. This allows it to adjust dynamically to changing market conditions, providing more reliable insights than traditional moving averages. Whether you’re a beginner or an experienced trader, the AMKA indicator can help improve your accuracy in spotting entry and exit points.
Key Features of the AMKA Indicator
Adaptive and Customizable Settings
One of the key features of the AMKA indicator for MT5 is its ability to be customized according to each trader’s preferences. Traders can modify the parameters—such as sensitivity, color schemes, and signal frequency—to match their individual trading style. This flexibility helps refine market analysis and tailor the indicator to specific strategies.
Trend Identification and Confirmation
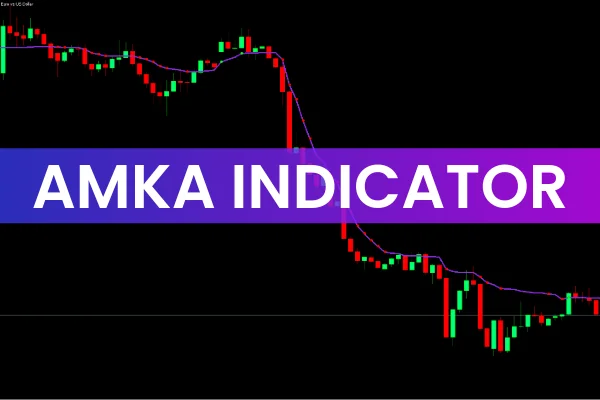
The indicator uses a 9-day adaptive moving average (AMA) to determine Trend Reversal points and the direction of current market movement. In trending markets, the AMA line often acts as a dynamic support or resistance level, helping traders identify potential buy or sell zones.
Visual Simplicity for Better Decision-Making
The AMKA indicator uses colored dots to indicate potential trade signals—green for bullish trends and red for bearish trends. This visual approach simplifies complex market data, allowing traders to make quick, confident decisions without cluttered charts.
How to Trade Within Correct Market Trends Using the AMKA Indicator in MT5
The AMKA Indicator MT5 is particularly effective for identifying accurate market trends. When the price stays above the AMA line and green dots appear, this indicates a strong buying opportunity. Traders should consider entering long positions and placing stop losses below the nearby support level.
Conversely, when the price breaks below the AMA line and red dots appear, it signals a potential downtrend. This scenario presents an opportunity to enter short trades, with stop losses placed above the resistance zone.
By consistently following these signals, traders can enhance their ability to stay aligned with the prevailing trend and minimize the risk of false entries.
Benefits of Using the AMKA Indicator for MT5
Accurate Trend Detection: Helps traders confirm market direction with high precision.
Customizable Settings: Adapt the indicator to your preferred trading system.
User-Friendly Design: Easy to interpret, even for novice traders.
Versatility: Works well across Forex, stocks, and commodities markets.
Using the AMKA indicator for MT5 can improve your overall trading performance by helping you understand price movements, spot trend reversals, and identify high-probability trade setups.
Conclusion
The AMKA Indicator MT5 is a valuable addition to any trader’s toolbox. By analyzing price movements and using the adaptive moving average to determine market trends, traders can make informed and data-driven decisions.
With flexible customization options, strong technical insights, and an easy-to-read interface, this indicator simplifies market analysis while maintaining accuracy. To explore more professional-grade trading tools like the AMKA indicator, visit IndicatorForest.com and enhance your trading strategy today.
FAQ
3 Downloads
Published:
Nov 07, 2025 14:19 PM
Category: