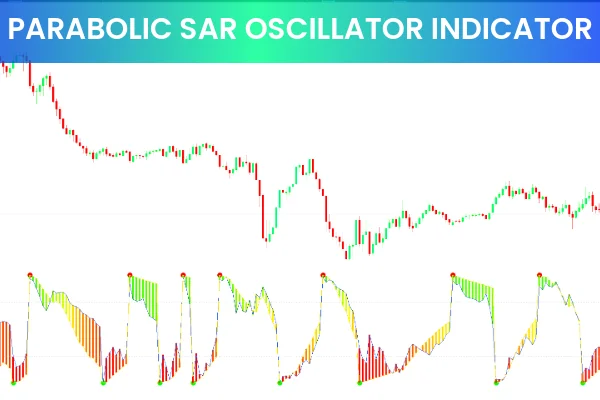
The Parabolic SAR Oscillator for MT5 by LuxAlgo is a re-engineered version of the traditional Parabolic SAR indicator. Instead of plotting dots above or below the price, it transforms SAR data into an oscillator format, giving traders a smoother and clearer view of market momentum and potential reversals.
This innovative approach helps reduce chart clutter while improving the accuracy of trend identification. Traders can now easily recognize overbought or oversold conditions, trend exhaustion points, and momentum shifts through a color-coded histogram and turning-point markers.
Whether you’re trading Forex, stocks, or commodities, this tool offers a structured, visual way to interpret the same information provided by the classic SAR, but in a more intuitive and flexible form.
Why Use the Parabolic SAR Oscillator?
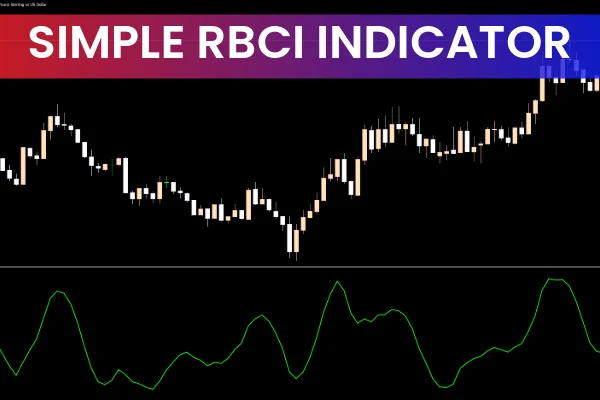
Traditional Parabolic SAR indicators can sometimes overwhelm traders with dot-based signals that clutter the chart—especially during sideways markets. The Parabolic SAR Oscillator eliminates this issue by displaying momentum in a histogram band below the chart, providing a cleaner and more organized trading interface.
This design allows traders to:
Detect trend reversals earlier.
Identify momentum strength through bar slope and color.
Combine signals with other momentum tools (like RSI or MACD) for stronger confirmation.
Visualize both trend direction and market speed without crowding the chart.
For intraday and swing traders, this refined format enhances timing accuracy while filtering out market noise.
Parabolic SAR Oscillator Trading Signals
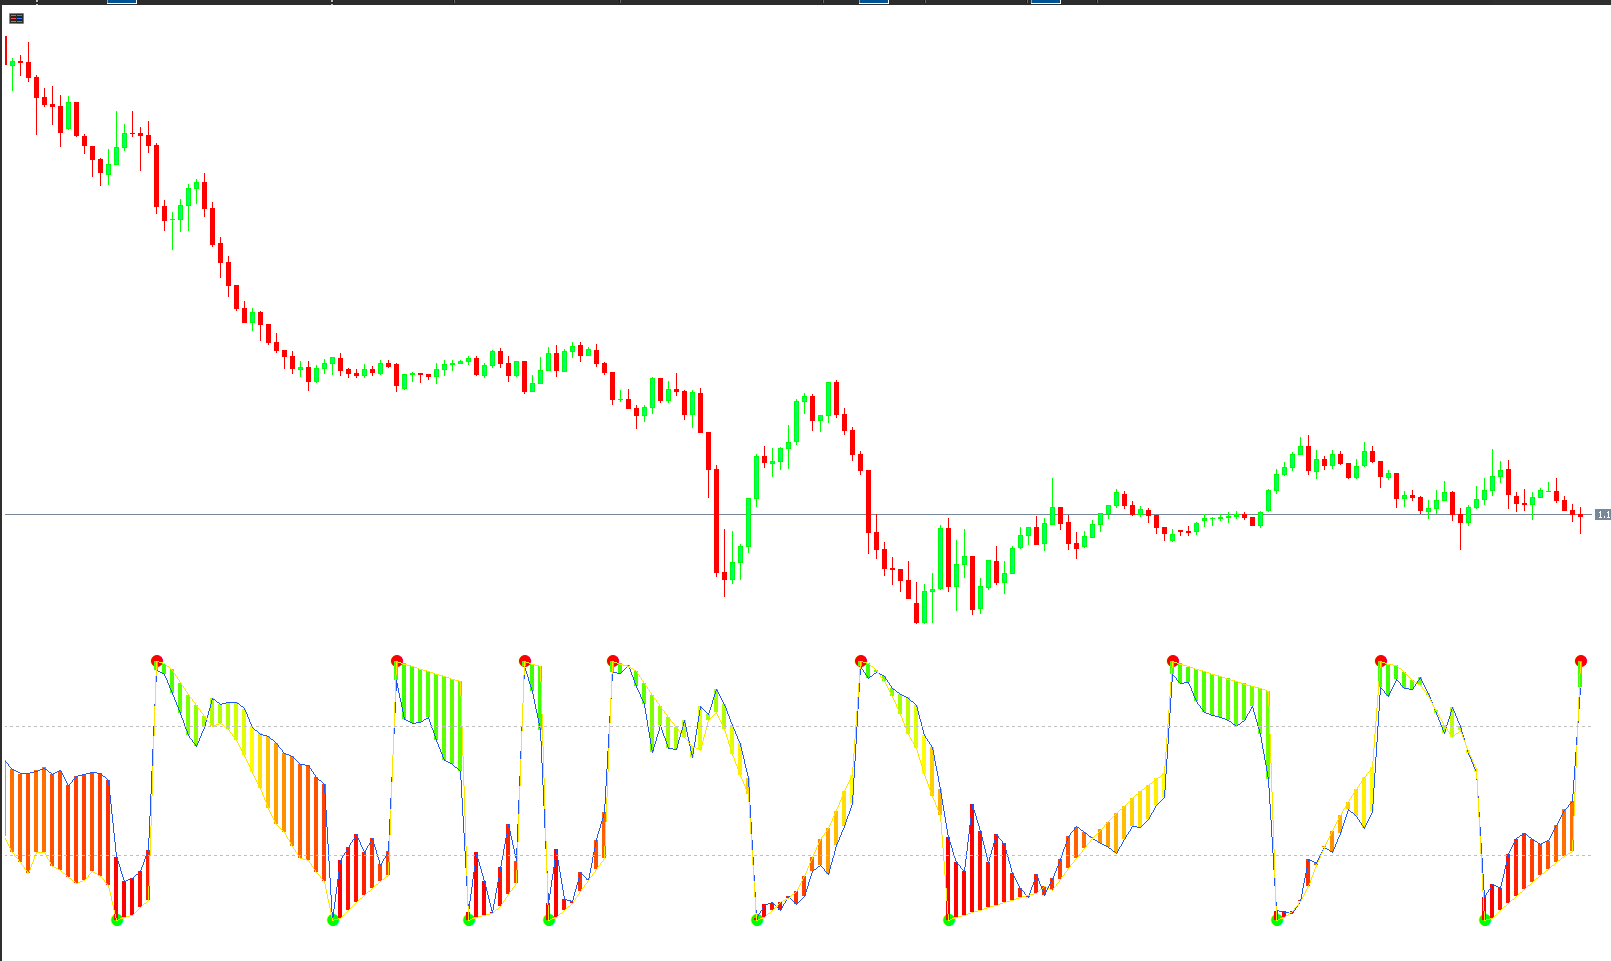
The LuxAlgo Parabolic SAR Oscillator operates using histogram bars that fluctuate around a neutral baseline. The position, color, and slope of the bars indicate market momentum and trend direction.
Here’s how to interpret its signals:
Bullish Momentum (Buy Setup):
The histogram rises toward positive territory, showing building bullish strength.
When the oscillator reaches an extreme high and starts to decline, it suggests that bullish momentum may be fading, hinting at an upcoming reversal.
A green marker dot at the bottom of a swing indicates a potential buy signal or trend continuation point.
Bearish Momentum (Sell Setup):
The histogram drops into negative territory, indicating bearish pressure.
When it reaches a deep negative extreme and then turns upward, it may signal weakening bearish momentum and a potential bullish reversal.
A red marker dot at the top of a cycle confirms possible selling opportunities.
Color-Coded Bars:
Green bars: Momentum increasing upward (bullish bias).
Red bars: Momentum increasing downward (bearish bias).
Neutral bars: Indicate consolidation or potential transition between trends.
This oscillator gives traders a visual cue for market strength, allowing them to react quickly to momentum shifts.
How To Trade with the Parabolic SAR Oscillator
To effectively use this indicator on your MT5 platform:
Apply the Parabolic SAR Oscillator to your chart.
Wait for the oscillator to change slope direction or marker dots to appear (green for buy, red for sell).
Confirm momentum changes with Price Action (e.g., candle structure or breakouts).
Combine with other LuxAlgo tools like CHoCH (Change of Character) or Smart Money Concepts for added confirmation.
Exit trades when the oscillator starts flattening or shows opposite-colored bars, signaling momentum slowdown.
This method helps you capture entries at trend beginnings and avoid false reversals during sideways markets.
Advantages of the Parabolic SAR Oscillator for MT5
Modernized visualization of Parabolic SAR data.
Reduces chart clutter by replacing dots with a clean oscillator.
Color-coded momentum bands make it easy to spot direction changes.
Works across all timeframes and instruments.
Ideal for both trend-following and counter-trend traders.
Developed by LuxAlgo, a trusted name in advanced trading indicators.
This indicator simplifies decision-making and improves timing precision for traders at any skill level.
Conclusion
The Parabolic SAR Oscillator for MetaTrader 5 by LuxAlgo is a modern momentum-based enhancement of the classic Parabolic SAR. By converting traditional SAR signals into a visually appealing oscillator, it enables traders to see market reversals, trend changes, and exhaustion points more clearly.
If you’re looking to refine your trading analysis with cleaner visuals and stronger momentum cues, this indicator is a must-have addition to your trading toolkit.
You can download the Parabolic SAR Oscillator for MT5 and explore more premium tools at IndicatorForest.com — your destination for advanced MetaTrader indicators and expert advisors.
FAQ
28 Downloads
Published:
Nov 08, 2025 21:53 PM
Category: