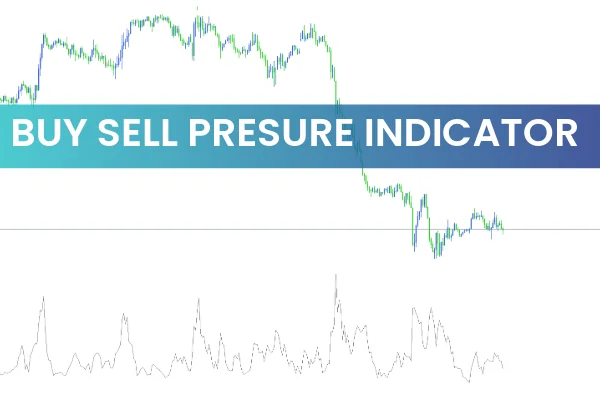
The RBCI Indicator MT5 is a specialized trading tool designed to measure the difference between buying and selling pressure in financial markets. By analyzing market dynamics, the indicator helps traders determine trend direction, momentum, and potential reversals. Suitable for beginners, intermediate, and advanced Forex traders, this tool provides clear insights into market behavior without overcomplicating analysis.

How the RBCI Indicator MT5 Works
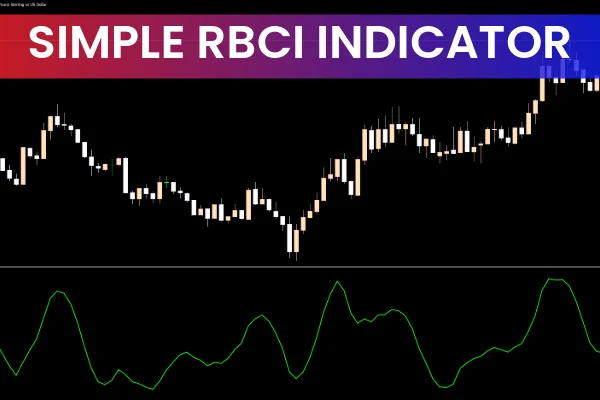
The RBCI indicator uses a histogram that fluctuates above and below a zero line, separating positive and negative zones:
Positive Zone (Above Zero Line): Indicates strong buying pressure, suggesting bullish momentum.
Negative Zone (Below Zero Line): Indicates selling pressure, highlighting bearish momentum.
These histogram signals provide traders with a clear visual representation of market energy, helping them decide when to enter or exit trades.
Key Features of the RBCI Indicator MT5
Histogram-Based Trend Analysis
The histogram bars visually represent buying and selling pressure, allowing traders to quickly interpret market sentiment.
Zero-Line Cross Signals
The RBCI Indicator MT5 generates potential trading signals when the histogram crosses the zero line:
Crossing Above Zero: Consider a potential buy opportunity
Crossing Below Zero: Consider a potential sell opportunity
Divergence Detection
Traders can spot divergences between Price Action and the histogram to identify potential reversals. For example:
Positive Divergence: Price drops while histogram rises, signaling a possible bullish reversal
Negative Divergence: Price rises while histogram falls, signaling a possible bearish reversal
Flexible Trading Application
The indicator can be combined with other trend-following or price action indicators to reduce false signals and increase trade accuracy.
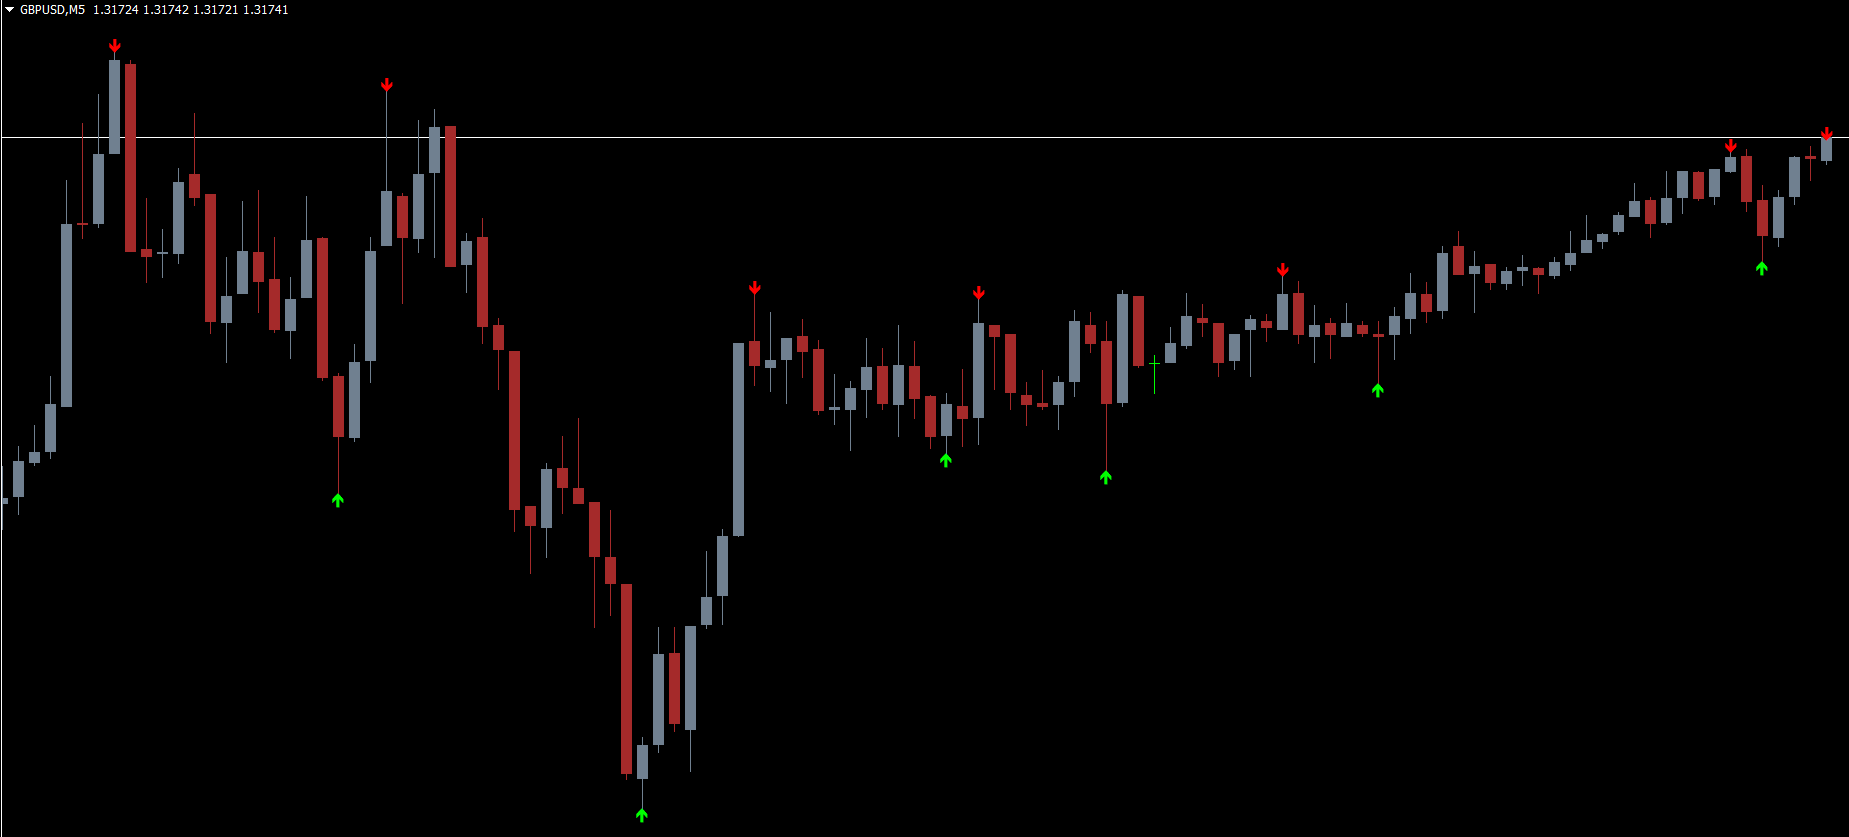
How Traders Use the RBCI Indicator MT5
Using the RBCI Indicator MT5 involves monitoring histogram movement, zero-line crossovers, and divergences:
Buy Signal: When the histogram crosses above zero or shows a positive divergence from price
Sell Signal: When the histogram crosses below zero or shows a negative divergence from price
Traders often integrate this tool with support/resistance levels, moving averages, or momentum indicators to confirm entries and exits. Its visual simplicity makes it easy to use across different timeframes, including M30, H1, and daily charts.
Benefits of the RBCI Indicator MT5
Provides clear visualization of bullish and bearish market pressure
Helps identify trend direction and potential reversals
Useful for traders of all skill levels
Enhances decision-making by complementing other technical indicators
Supports multiple timeframes and trading strategies
By combining trend analysis and market pressure data, the RBCI Indicator MT5 helps traders optimize timing and improve the quality of trade setups.
Conclusion
The RBCI Indicator MT5 is a reliable tool for assessing buying and selling pressure, spotting market trends, and identifying potential reversal points. While it provides clear signals, traders should always use proper risk management strategies to protect their trading capital. When combined with other technical tools, this indicator enhances trading decisions and supports more disciplined, informed strategies.
Visit IndicatorForest.com for more MT5 indicators, trading tools, and strategy resources.
FAQ
Published:
Dec 05, 2025 02:38 AM
Category: