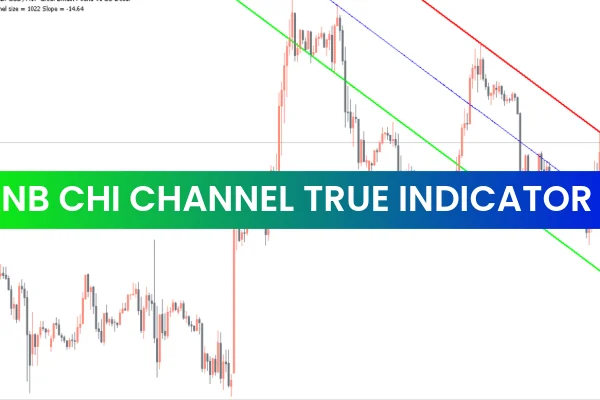
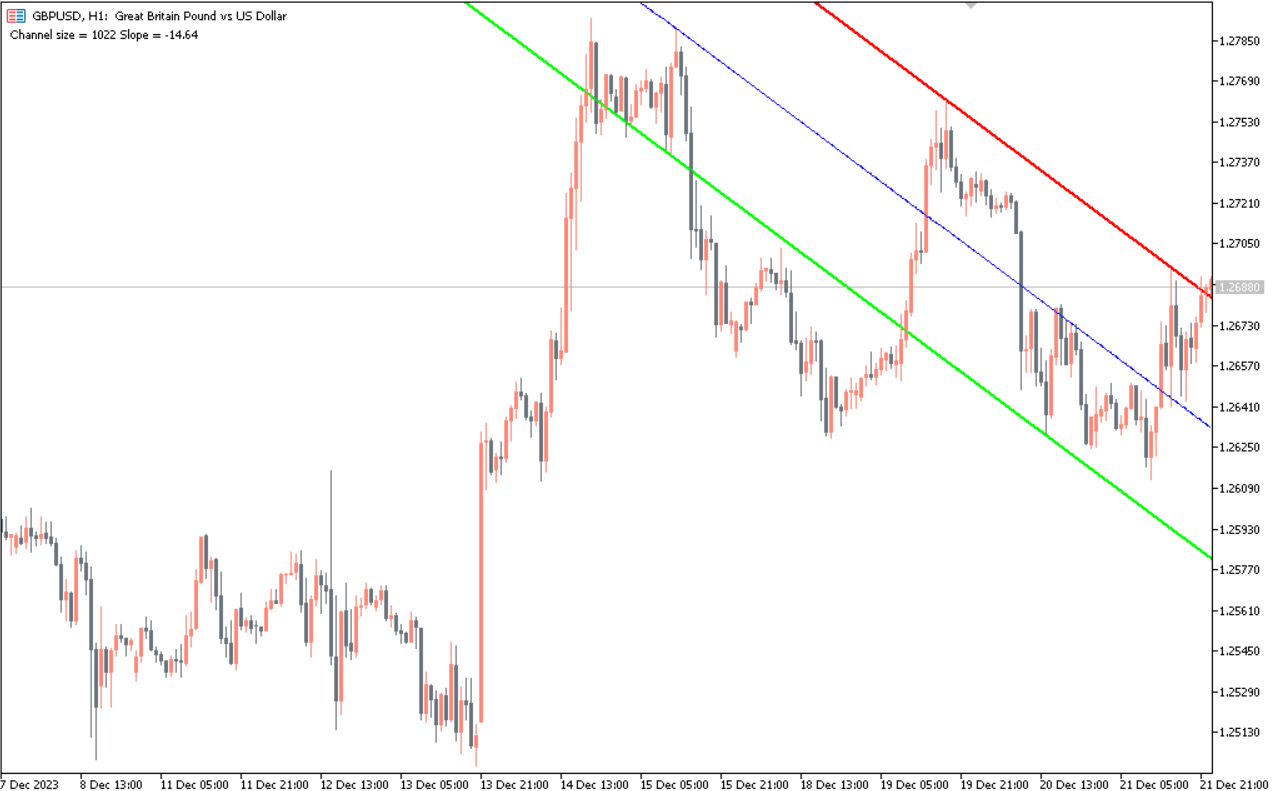
The NB Chi Channel True Indicator for MT5 is a fractal-based channel tool that helps traders analyze trend direction, potential Support And Resistance levels, and breakout opportunities. By plotting three distinct lines on the chart—upper, lower, and central—the indicator provides a clear visual representation of market structure and possible trading zones.
This indicator is ideal for Forex, indices, and commodities traders. Whether you are Scalping, day trading, or swing trading, the NB Chi Channel True Indicator provides actionable insights for both short-term and long-term market movements.
How the NB Chi Channel True Indicator Works
The NB Chi Channel True Indicator uses fractals to identify key price extremes over a selected number of bars:
Upper Line: Represents the highest fractal within the chosen timeframe, highlighting potential resistance.
Lower Line: Represents the lowest fractal, indicating potential support.
Central Line: Connects the upper and lower lines and serves as a guide to market trend direction.
By analyzing these three lines, traders can determine whether the market is trending, ranging, or preparing for a breakout. The indicator dynamically updates as new price data emerges, making it a responsive tool for real-time trading.
Trading Strategies Using the NB Chi Channel True Indicator
The indicator offers multiple ways to identify trading opportunities:
Breakout Trades
Bullish Breakout: When price moves above the central line and approaches the upper channel, it signals a potential long trade with resistance as the target.
Bearish Breakout: When price drops below the central line and approaches the lower channel, it signals a potential short trade with support as the target.
Trend Identification
The central line acts as a Trend Indicator. Price above the center suggests bullish momentum, while price below the center indicates bearish momentum.
Traders can combine this with moving averages or trend-following tools to confirm trend direction.
Support and Resistance
The upper and lower channel lines represent potential dynamic support and resistance levels.
Use these lines to set stop loss and take profit levels effectively.
Best Practices for Using the NB Chi Channel True Indicator
Confirm Signals: Avoid relying solely on the NB Chi Channel. Combine it with other indicators like RSI, MACD, or volume for stronger confirmation.
Use Proper Risk Management: Always set stop losses near the support or resistance levels indicated by the channel lines.
Timeframe Consideration: Higher timeframes reduce noise and provide stronger trading signals, while lower timeframes may give more frequent but less reliable signals.
Trend Alignment: Only take trades in the direction of the prevailing trend to increase the probability of success.
By following these best practices, traders can leverage the NB Chi Channel True Indicator to make informed, low-risk trading decisions.
Why Traders Prefer the NB Chi Channel True Indicator
Clear visualization of trend direction, support, and resistance
Dynamic fractal-based calculation for accurate real-time signals
Works on all MT5 timeframes for short-term or long-term trading
Enhances entry and exit timing for breakout and range strategies
Simple and intuitive interface suitable for beginners and professionals
This indicator combines visual clarity with analytical precision, making it a valuable addition to any trader’s toolkit.
Conclusion
The NB Chi Channel True Indicator for MT5 is a reliable tool for identifying trend direction, support, resistance, and breakout opportunities. By plotting the upper, lower, and central lines based on fractals, it gives traders a clear view of Market Structure and actionable trading zones.
Download the NB Chi Channel True Indicator today from IndicatorForest.com and improve your MT5 trading strategy with precise fractal-based channel analysis.
FAQ
3 Downloads
Published:
Dec 09, 2025 03:58 AM
Category: