The Trend Manager indicator for MetaTrader 5 (MT5) is a powerful technical analysis tool designed to detect long-term trading opportunities in the Forex market. Known for its reliability in identifying trend reversals, the indicator helps determine the potential long-term direction of any financial instrument.
This makes it highly valuable for day traders, intraday traders, and swing traders who aim to capture extended moves in the market. Each reversal signal produced by the indicator can result in significant pip movement, making it an essential tool for traders who rely on trend-based strategies.
Discover More
MetaTrader 5 • Algorithmic Trading • MT5 • Algo Trading • MetaTrader 4 • MT4 • Broker Comparison Service • MT4 Indicators • Trading Strategy Guide • Forex Trading Course
How to Use the Trend Manager Indicator
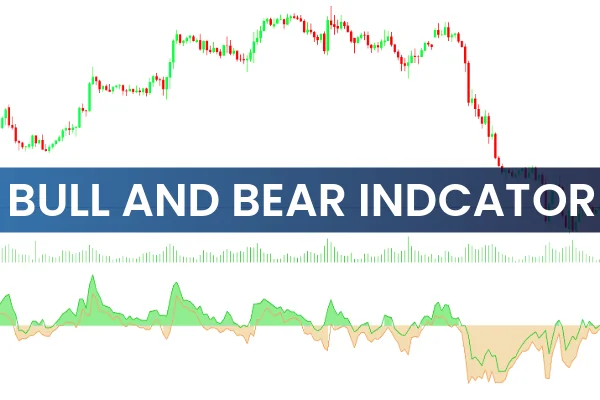
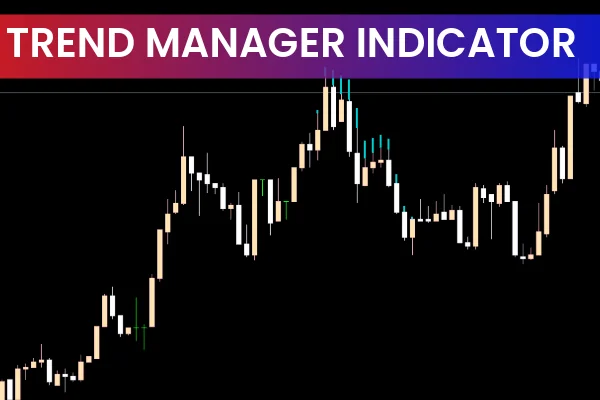
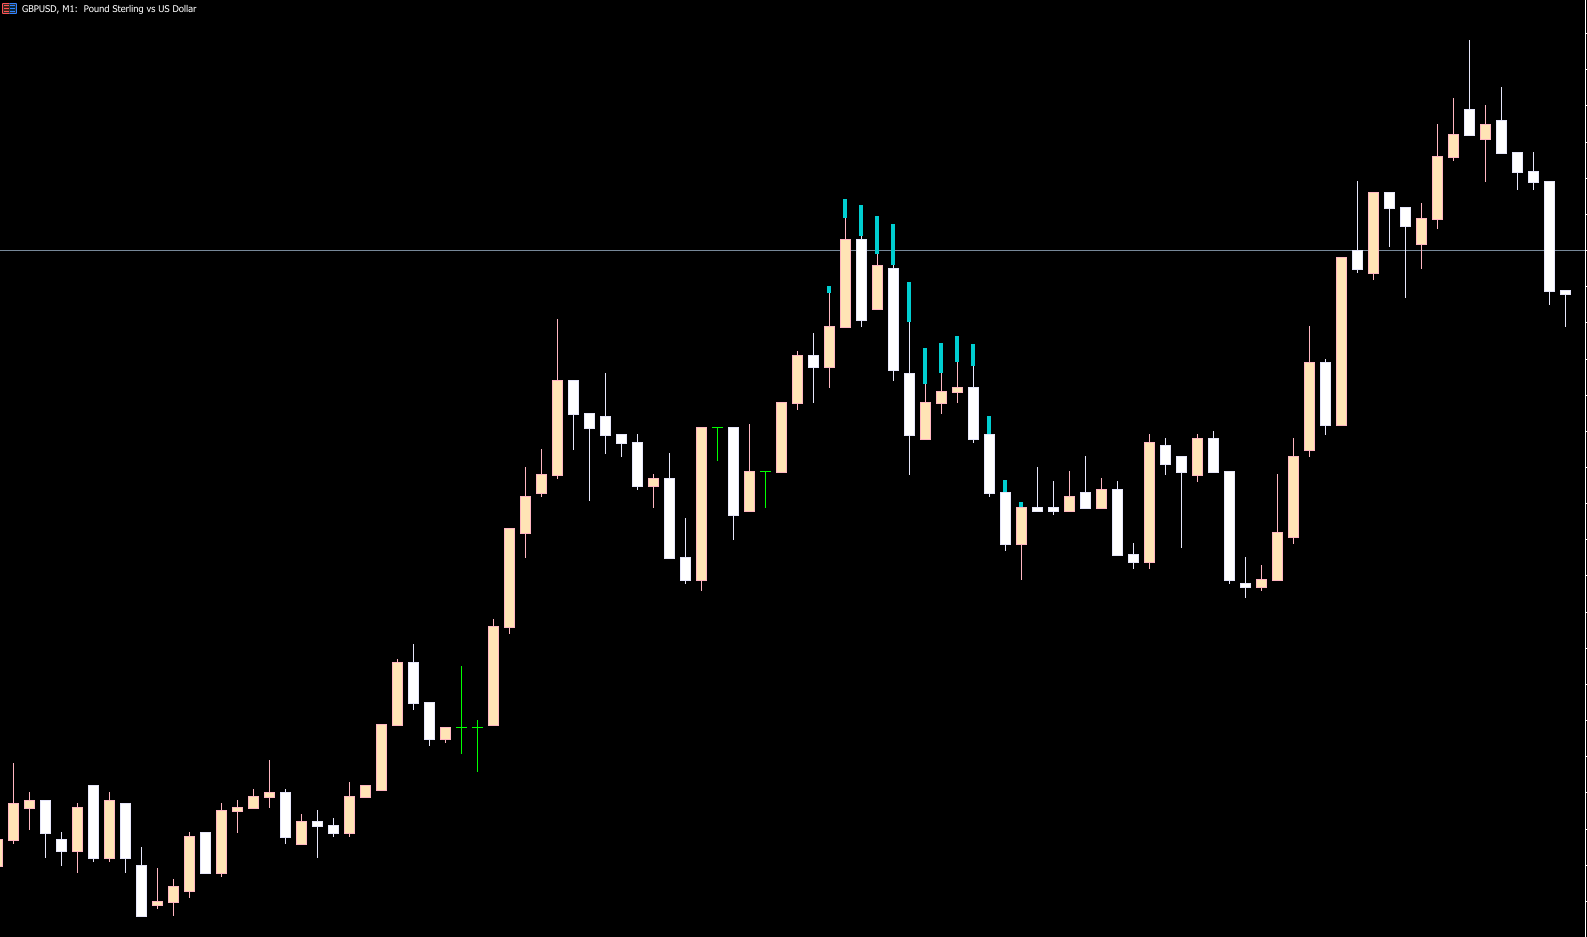
The indicator displays clear visual signals to help traders understand market direction. As shown in the reference example:
Blue bars appear on top of candles, signaling the start of a potential long-term bullish trend.
Pink bars appear below candles, indicating the beginning of a potential bearish trend.
As long as the trend continues, the indicator keeps printing blue or pink bars to show ongoing momentum. While the Trend Manager is highly effective on its own, it performs best when paired with Price Action signals—such as bullish or bearish engulfing candles—to confirm optimal trade entries.
This combination allows traders to confidently position themselves with the long-term market direction while minimizing false signals.
Conclusion
The Trend Manager Indicator for MT5 is a dependable trend analysis tool that highlights the beginning of long-term bullish or bearish movements. Its simplicity, visual clarity, and accuracy make it an excellent addition for intraday and swing traders looking to capitalize on extended market trends. Incorporate it into your strategy to enhance your directional confidence and improve overall trade timing.
FAQ
1 Download
Published:
Dec 08, 2025 04:36 AM
Category: