The MACD RSI Indicator for MT5 is a powerful yet simple trading tool that merges two of the most reliable oscillators in the forex market: MACD and RSI. This combination allows traders to read momentum, Trend Strength, and overbought/oversold conditions more accurately within a single indicator window.
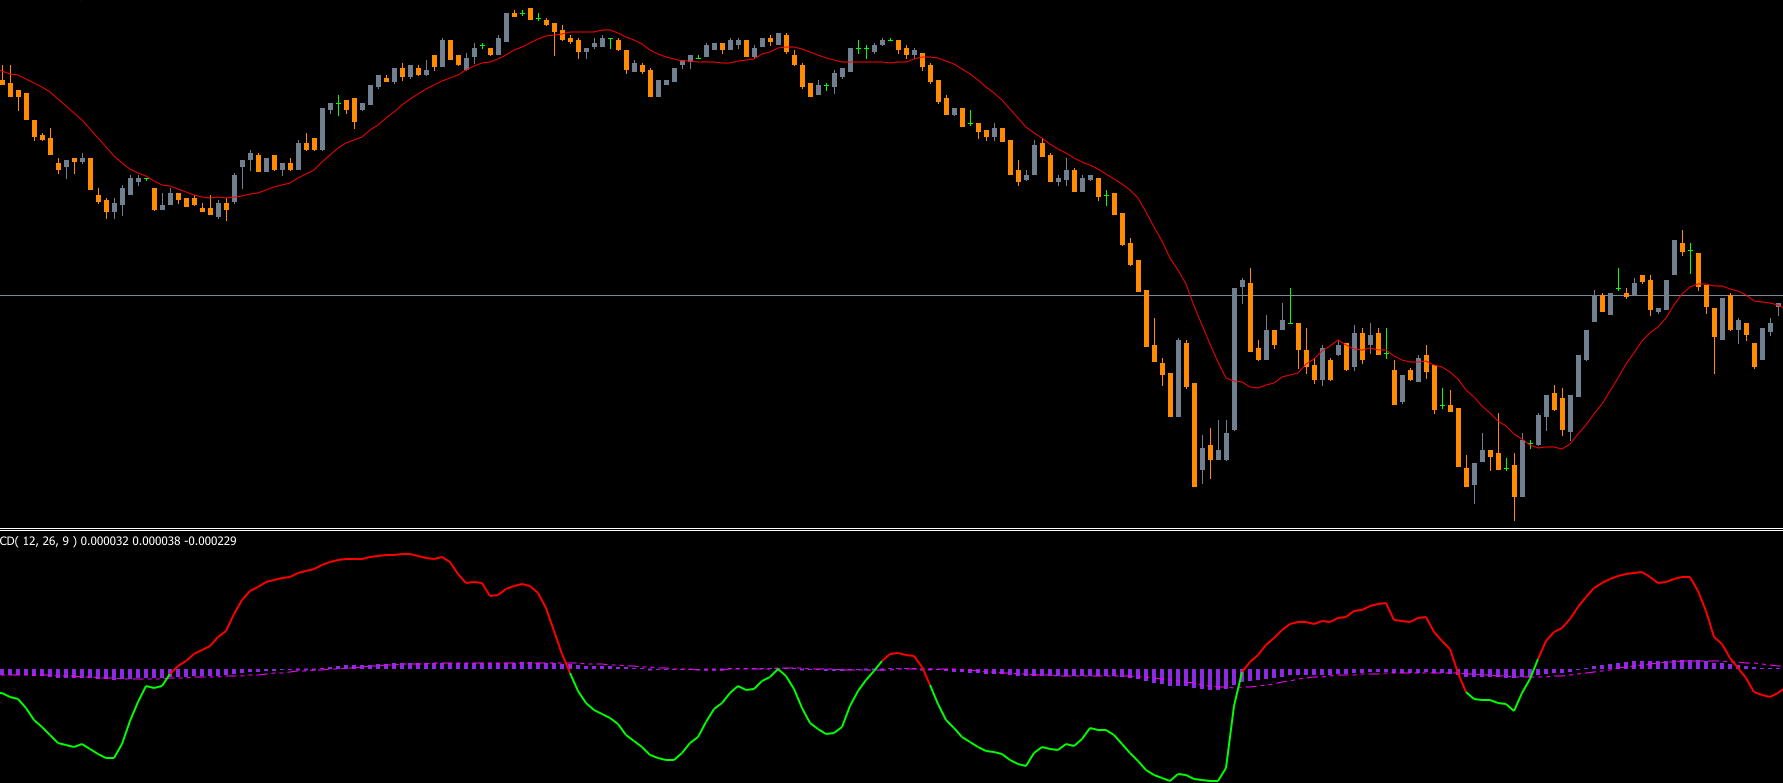
The indicator is built using three moving averages—fast EMA, slow EMA, and signal SMA—along with an additional 5-period moving average. In the display, the magenta line represents the Signal SMA, while the green-red line represents the slow RSI.
Unlike the traditional MACD, which typically plots a histogram below the chart, the MACD RSI Indicator for MT5 plots colored bars to indicate the overall trend direction. The RSI component then enhances signal accuracy by highlighting overbought and oversold levels. Similar to a standard RSI, values above 70 represent an overbought market, while readings at 30 or below indicate oversold conditions.
As a momentum-based oscillator, the MACD RSI indicator fluctuates within fixed levels and performs well on all timeframes. However, many traders find it particularly effective on higher timeframes, where market noise is reduced and signals are more consistent.
MACD RSI Indicator BUY/SELL Signals
The GBP/USD H1 chart demonstrates how BUY and SELL signals are generated using the indicator. Traders must first identify whether the market is overbought or oversold to determine valid entry points.
Conditions for a BUY Signal
To enter a long trade, the following must be present:
The bars must be in the oversold zone.
The fast EMA should be positioned below the slow EMA.
At times, these conditions may be met while price moves in the opposite direction. This usually happens during volatile market phases. Therefore, traders should always wait for Price Action to resume upward momentum before executing a BUY order.
Conditions for a SELL Signal
To enter a short position, look for:
The bars must be in the overbought zone.
The slow EMA should be below the fast EMA.
Just like BUY setups, the signals may appear prematurely in choppy markets. Traders should wait for confirmation of downward price movement before opening a SELL trade.
Conclusion
The MACD RSI Indicator for MT5 combines the strengths of two popular momentum oscillators to deliver clear BUY and SELL signals. By analyzing trend direction and market pressure simultaneously, traders can identify accurate entry and exit opportunities across multiple timeframes.
You can download this indicator for free from our website.
FAQ
14 Downloads
Published:
Nov 26, 2025 02:12 AM
Category: