Mastering Forex Trends with the Nduet Indicators for MT
Navigating the foreign exchange market requires a reliable strategy to separate market noise from actionable trends. For traders utilizing the MetaTrader 4 (MT4) platform, the Nduet Indicators system offers a streamlined, visual approach to technical analysis. By combining moving averages with dynamic crossover signals, this tool simplifies trend identification and helps traders pinpoint high-probability entry and exit points.
Here is an in-depth look at how the Nduet Indicators system works and how you can integrate it into your trading workflow.
Understanding the Nduet Indicators Visual Framework
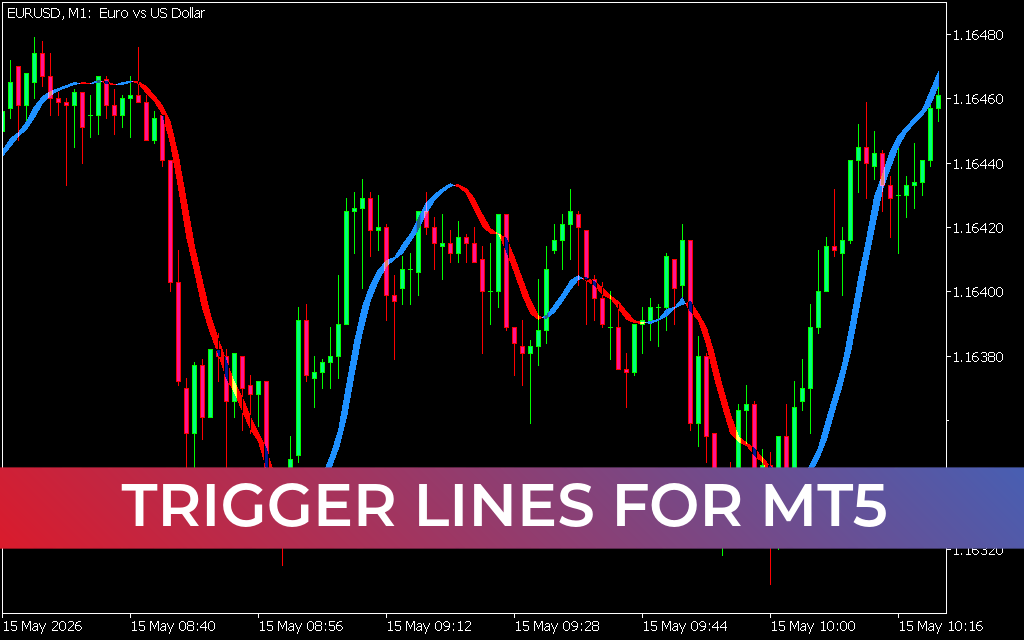
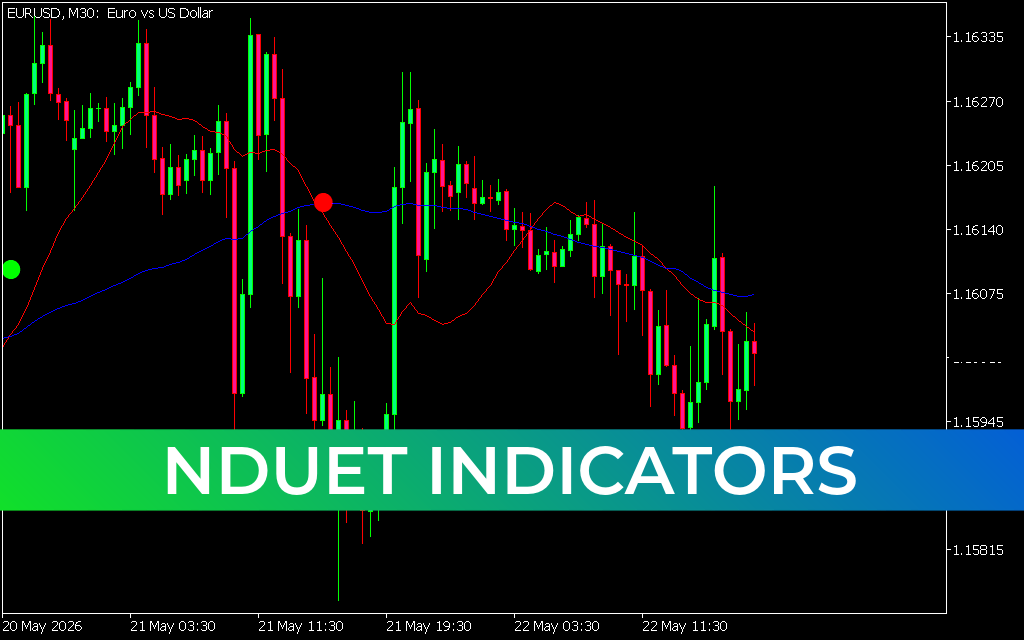
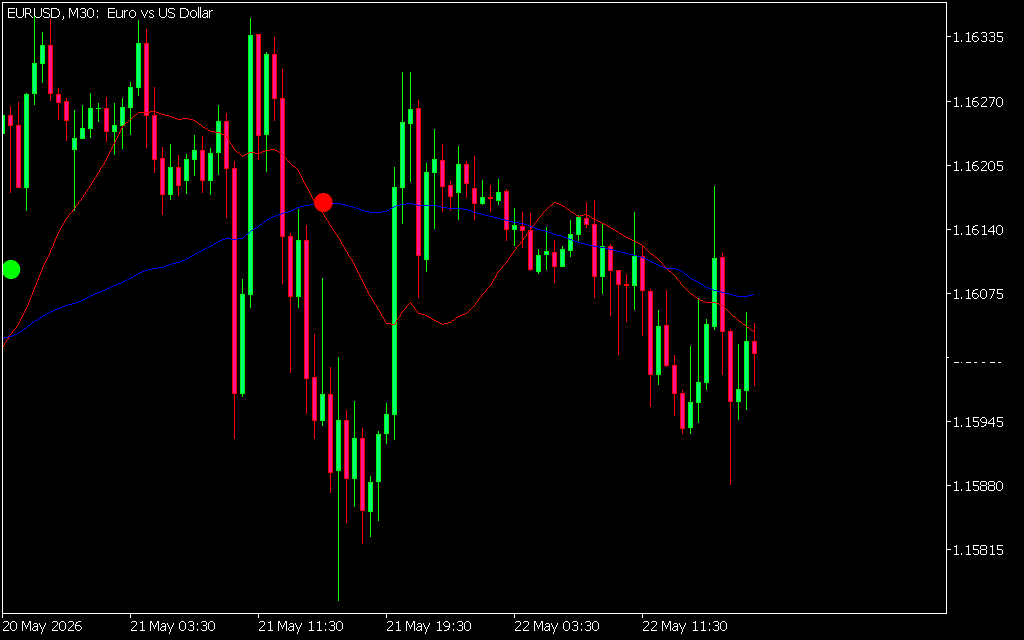
The Nduet Indicators system is built around clarity. It overlays two primary moving average lines onto your MT4 candlestick chart, supplemented by clear color-coded visual markers.
- The Fast Moving Average (Red Line): Tracks short-term price momentum, reacting quickly to sudden market shifts.
- The Slow Moving Average (Blue Line): Gauges the broader, macro-trend direction to keep you aligned with the dominant market force.
- Signal Dots (Green and Red): Automated crossover alerts that remove the guesswork from trend transitions.
By analyzing the interaction between these two lines, the system filters out minor price fluctuations, allowing you to focus purely on sustained market moves.
How to Trade with Nduet Indicators
The core strength of the Nduet system lies in its execution simplicity. It provides straightforward triggers for both bullish and bearish market conditions.
1. Bullish Reversals (Buy Signals)
A buy signal is initiated when the fast-moving red line crosses above the slow-moving blue line from below. This shift indicates that short-term buying momentum is outpacing historical averages. The system confirms this transition by printing a green dot on the chart. Traders typically look for this setup to capture the beginning of a fresh upward trend.
2. Bearish Reversals (Sell Signals)
Conversely, a sell signal occurs when the fast-moving red line crosses below the slow-moving blue line. This demonstrates escalating selling pressure. The indicator flags this crossover with a red dot. When a red dot appears, it serves as a technical cue that the market is entering a downtrend, signaling an opportunity to short the asset or exit existing long positions.
Optimizing Your Strategy
While the Nduet Indicators system is powerful on its own, its performance increases significantly when combined with disciplined risk management:
- Timeframe Selection: The indicator adapts smoothly across various timeframes. Using it on intermediate charts, like the 30-minute (M30) or 1-hour (H1) charts, balances early trend detection with strong noise reduction.
- Confluence Trading: Pair the crossover dots with established Support And Resistance levels. Entering a buy trade near a major support zone when a green dot appears increases the probability of a successful trade.
- Risk Control: Always place stop-loss orders just beyond recent swing highs or lows to protect your capital against sudden market reversals.
1 Download
Last Update:
May 22, 2026 20:57 PM
Published:
Jan 17, 2026 14:19 PM
Category: