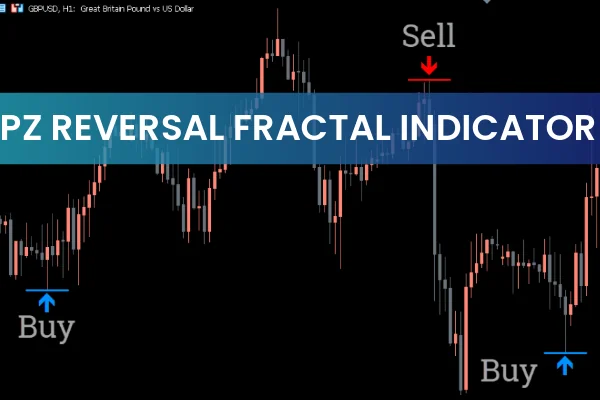
The PZ Reversals Fractals Indicator is a powerful MT5 tool designed to help traders identify market reversals. By analyzing fractal patterns, the indicator draws arrows signaling potential trend changes.
Blue arrow: Indicates the end of a downtrend, suggesting a buy opportunity.
Red arrow: Marks the end of an uptrend, signaling a sell opportunity.
This tool works on all timeframes, though it’s recommended to analyze trends on timeframes above M30 for more reliable signals.
How the PZ Reversals Fractals Indicator Works
The indicator identifies fractal patterns, which are price formations showing local highs and lows. By scanning these formations, the indicator pinpoints areas where the market is likely to reverse direction.
Once a fractal-based reversal is detected:
A blue arrow appears at the bottom of a downtrend, signaling the potential start of an upward trend.
A red arrow appears at the top of an uptrend, signaling the potential start of a downward trend.
Traders can then open long positions when a bullish signal appears or short positions when a bearish signal occurs.
Trading Tips for the PZ Reversals Fractals Indicator
Confirm with Trend Direction
Even though the indicator works on all timeframes, it’s best to confirm trend direction on higher timeframes (H1 and above) before acting on signals from lower timeframes.
Combine with Other Indicators
Enhance accuracy by combining the PZ Reversals Fractals Indicator with Moving Averages, RSI, or support and resistance levels. This can reduce false signals and improve trade success rates.
Set Stop Loss and Take Profit
Use nearby support/resistance levels or fractal points for stop loss placement. Take profit targets can be set based on previous trend highs/lows or a risk-to-reward ratio.
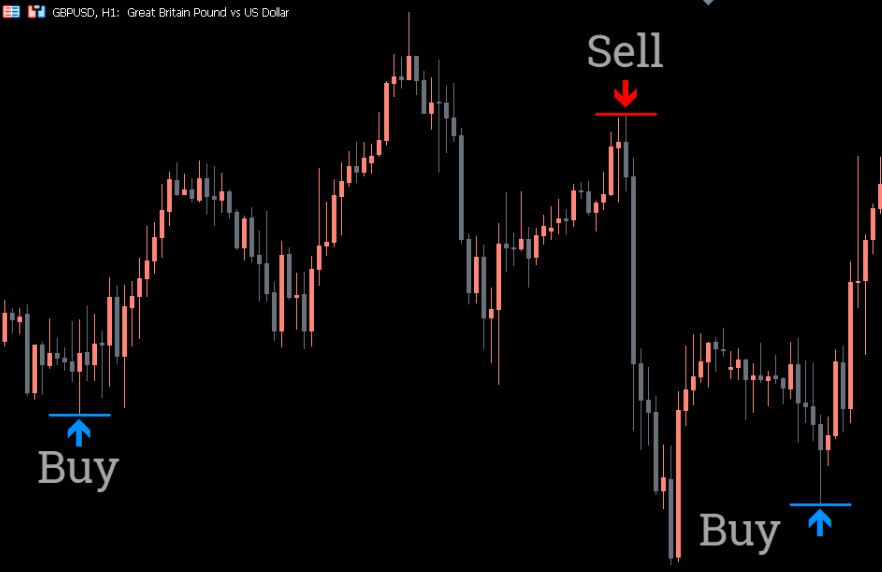
Example of Signals
For instance, on the GBP/USD H1 chart:
A blue arrow appears at the end of a downtrend — a signal to consider a buy trade.
A red arrow appears at the end of an uptrend — a signal to consider a sell trade.
By analyzing these signals and combining them with other indicators, traders can confidently enter long or short positions.
Conclusion
The PZ Reversals Fractals Indicator for MT5 is a valuable tool for identifying market reversals through fractal analysis. Its easy-to-read arrows simplify trade decisions and help traders open long or short positions with confidence.
Download the PZ Reversals Fractals Indicator for free at IndicatorForest.com and enhance your MT5 trading strategy.
FAQ
36 Downloads
Published:
Nov 11, 2025 03:34 AM
Category: