Decode Macro Market Trends with the Averages Rainbow Indicator for MT4
Pinpointing the exact moment a financial asset transitions from a corrective pullback into a massive macro expansion is the holy grail of trend trading. While standard individual moving averages can give lagging or conflicting signals, analyzing the market through a multi-layered smoothing matrix provides a clear view of institutional order flow. The Averages Rainbow Indicator for MetaTrader 4 (MT4) uses this layered approach, wrapping your Price Action in a dynamic moving average ribbon that reveals trend strength, support depth, and imminent market reversals.
By displaying the consensus of multiple timeframes simultaneously, this tool eliminates chart noise and helps swing traders and trend-followers ride major market moves with confidence.
What is the Averages Rainbow Indicator?
The Averages Rainbow indicator is an advanced technical charting utility that plots a dense ribbon of sequentially calculated moving averages. Instead of forcing you to guess which individual period length matters most, it maps an entire spectrum of trend depths onto your workspace to visually represent the market's underlying momentum.
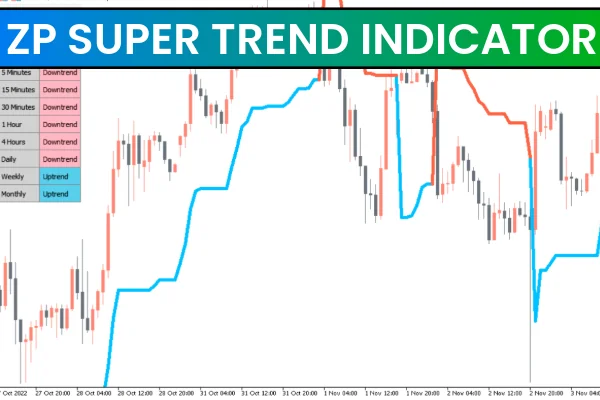
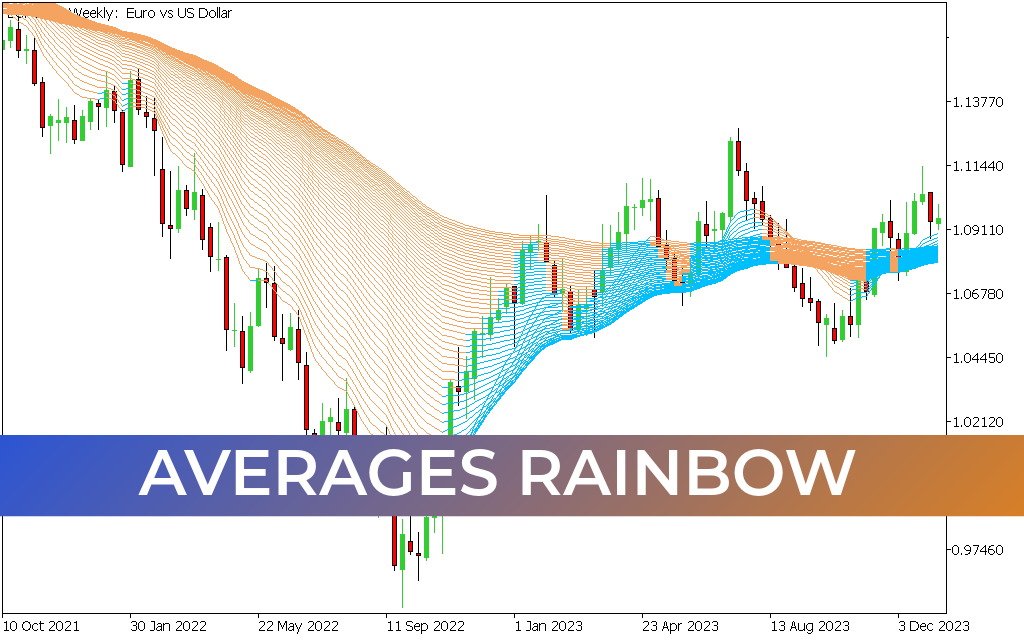
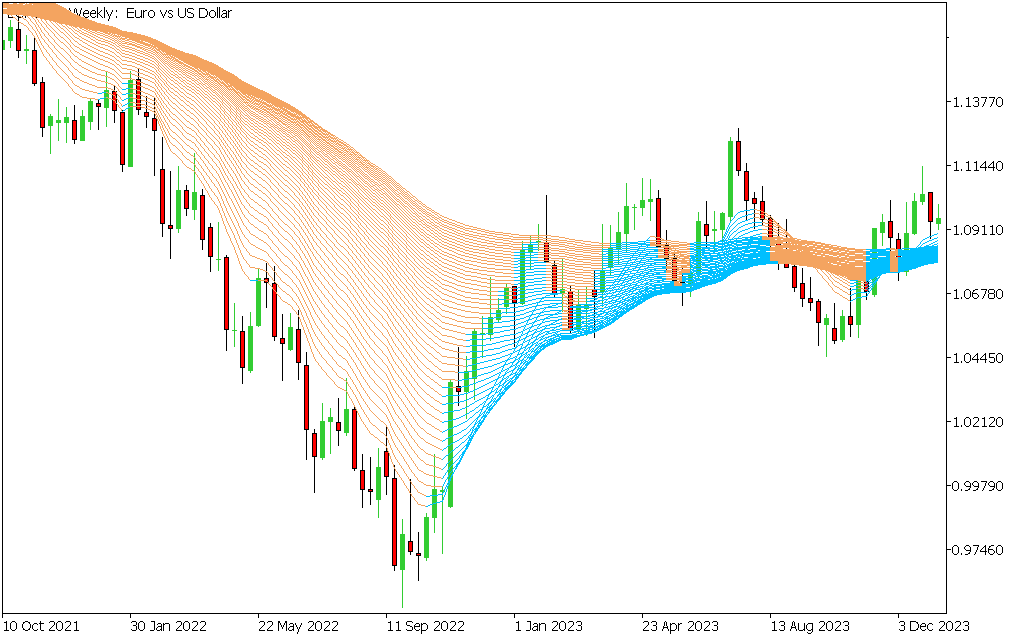
As shown on the EURUSD Weekly chart, the indicator uses color-coded ribbon fields to track structural shifts:
- The Orange Ribbon Matrix: Visualizes a dominant bearish regime and heavy overhead institutional resistance. When the ribbon expands downward, it confirms active short expansion.
- The Cyan Ribbon Matrix: Visualizes a robust bullish regime and strong underlying demand. An expanding upward ribbon confirms a healthy, sustainable markup phase.
When a major Trend Reversal occurs, the individual average lines compress tightly before expanding outward in the opposite direction, creating a clear visual map of the market cycle.
Key Features and Benefits
- Multi-Layered Trend Consensus: Combines dozens of moving average parameters into a single cohesive ribbon to eliminate conflicting technical indicators.
- Dynamic Support And Resistance: The thickness of the ribbon shows the strength of the trend; a thick ribbon acts as a reliable zone for pullbacks and re-entries.
- Color-Coded Regime Changes: Transitions seamlessly between orange and cyan, providing simple rules for determining trend direction.
- Macro Swing Tool: Highly effective on higher timeframes like the Weekly chart, helping you stay aligned with the primary market trend.
How to Trade with the Averages Rainbow Indicator
Using this comprehensive ribbon system within a structured technical workflow provides clear parameters for managing market risk:
- The Trend Continuation Buy (Cyan Alignment): During a macro bull market, look for the price to pull back into a fully expanded cyan ribbon. Treat the ribbon as a dynamic support zone. When a bullish reversal candle forms within the ribbon, enter long to catch the next upward expansion.
- The Trend Continuation Sell (Orange Alignment): In a verified bear market, look for corrective rallies that move upward into an expanded orange ribbon. Use this overhead resistance zone to look for short entry opportunities as momentum turns back down.
- The Compression Breakout Trigger: When the entire rainbow ribbon pinches closely together into a narrow band, it signals that the market is in a tight consolidation phase. Prepare for an explosive breakout, and enter in the direction of the subsequent ribbon expansion.
Conclusion
The Averages Rainbow MT4 indicator is an indispensable asset for systematic trend-following and momentum traders. By turning complex multi-period calculations into an easy-to-read ribbon matrix, it keeps you on the right side of major trends and highlights high-probability entry zones.
10 Downloads
Last Update:
May 23, 2026 22:28 PM
Published:
Jan 15, 2026 20:41 PM
Category: