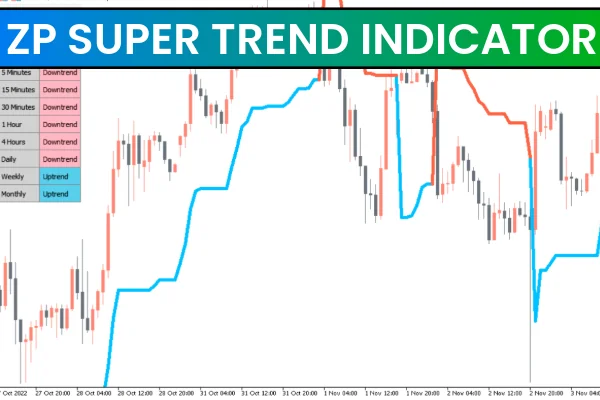
The ZP Super Trend Indicator for MT5 is a powerful trend-following tool designed to help forex and stock traders monitor multiple timeframes simultaneously. By combining the average true range (ATR) with a customizable multiplier, this indicator accurately identifies trend direction, highlighting potential buy and sell opportunities. Its signal line also acts as a dynamic support and resistance level, making it suitable for a wide range of trading styles, from Scalping to swing trading.
Key Features of the ZP Super Trend Indicator for MT5
The ZP Super Trend Indicator is designed for both novice and advanced traders, offering:
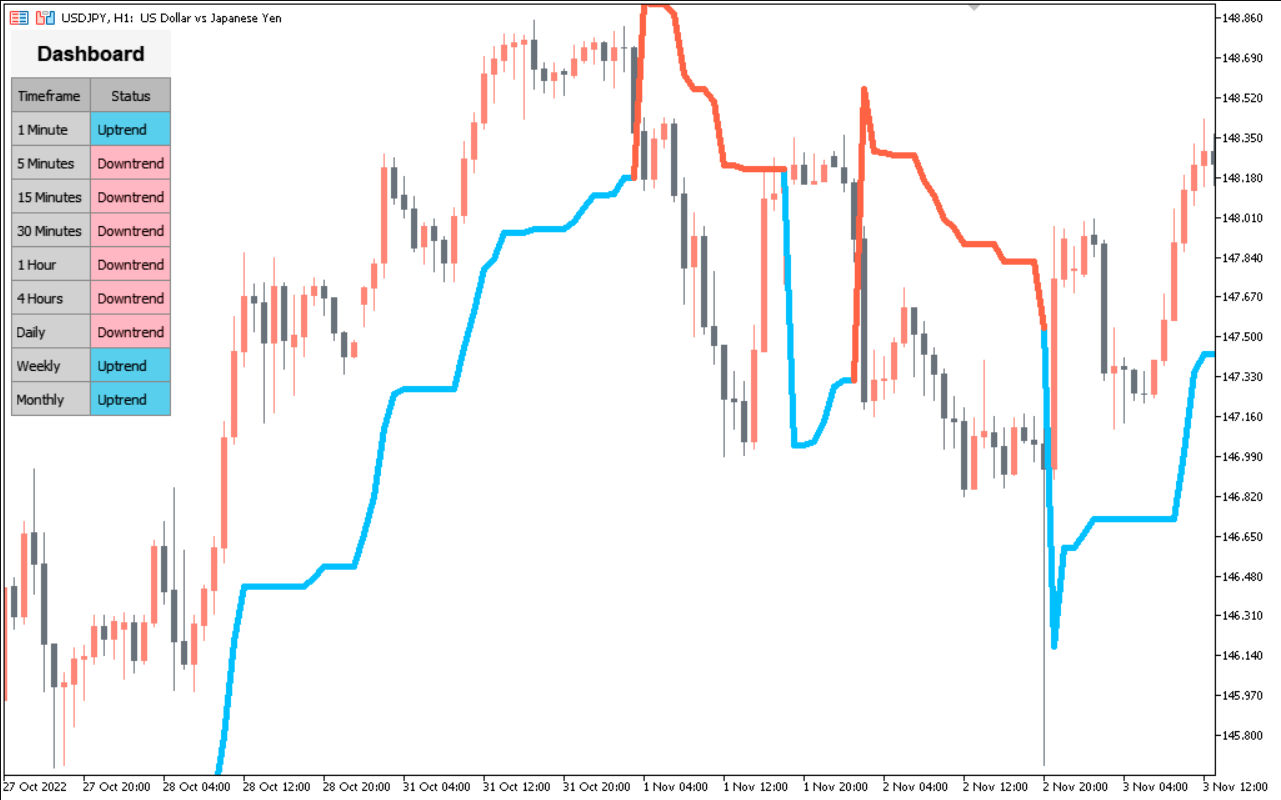
Multi-Timeframe Analysis: View trend conditions across H1, H4, daily, weekly, and monthly charts at a glance.
ATR-Based Trend Detection: Uses ATR and a multiplier to measure volatility and define trend direction.
Signal Line: Provides clear buy and sell signals while serving as dynamic support/resistance.
Versatility: Effective for scalping, intraday trading, and swing trading.
Ease of Use: Intuitive interface suitable for beginners while providing advanced features for professionals.
This combination ensures traders can spot strong trends and confluences across different timeframes without constantly switching charts.
How the ZP Super Trend Indicator Works
The indicator calculates trend direction using ATR and a multiplier to measure market volatility. A bullish trend is indicated when the price stays above the signal line, while a bearish trend is detected when the price remains below the signal line. The multi-timeframe toolbar allows traders to instantly see whether shorter-term trends align with longer-term trends, providing a strong confluence signal.
The signal line can also be used as dynamic support or resistance. For example, during a bullish trend, the signal line may act as a support level where traders can consider adding to long positions. In a bearish trend, it can act as a resistance zone for potential short trades.
How to Trade With the ZP Super Trend Indicator
SELL Setup
Identify a bearish trend across multiple timeframes using the multi-timeframe toolbar.
Confirm the price is below the signal line.
Wait for a price reaction, such as a wick rejection or bearish candlestick pattern (e.g., engulfing).
Open a SELL trade, placing a stop-loss above the recent swing high.
BUY Setup
Identify a bullish trend across multiple timeframes.
Confirm the price is above the signal line.
Wait for a price reaction near the signal line or bullish candlestick confirmation.
Open a BUY trade, placing a stop-loss below the recent swing low.
This method ensures trades are aligned with the main trend and supported by clear entry signals.
Why Traders Should Use the ZP Super Trend Indicator
Trend Confirmation: Easily identify the dominant trend across several timeframes.
Reduced Noise: ATR-based calculation reduces false signals in choppy markets.
Dynamic Levels: Signal line acts as Support And Resistance for better risk management.
Versatility: Suitable for all trading styles and instruments, including forex, indices, and stocks.
Conclusion
The ZP Super Trend Indicator for MT5 is a comprehensive tool for trend-following traders. By combining ATR-based calculations, signal lines, and multi-timeframe analysis, it provides precise insights into market conditions. Whether you are a beginner or experienced trader, this indicator helps you spot strong trends, confluences, and entry points with confidence. It is free to download and can be an essential part of your trading strategy.
For more high-quality trading tools and MT5 indicators, visit IndicatorForest.com today.
FAQ
The ZP Super Trend Indicator is a trend-following tool that plots a dynamic line above or below price to indicate trend direction. When the line is below price and green, it signals an uptrend. When the line is above price and red, it signals a downtrend. The indicator uses ATR (Average True Range) to calculate the dynamic stop level, making it adaptive to market volatility.
Enter long positions when the Super Trend line turns green and moves below price, indicating an uptrend. Enter short positions when the Super Trend line turns red and moves above price, indicating a downtrend. Use the Super Trend line as a dynamic stop-loss level, moving your stop as the trend continues. Exit trades when the line changes color, signaling a potential trend reversal.
The indicator uses ATR-based calculations that adapt to market volatility, providing dynamic support and resistance levels. It filters out market noise by focusing on trend direction rather than minor price fluctuations. The visual color coding (green for uptrend, red for downtrend) makes it easy to identify trend direction at a glance.
Combine with momentum indicators like RSI or MACD to confirm trend strength, use with support and resistance levels to identify high-probability entry points, apply multi-timeframe analysis to confirm trend alignment, and pair with volume indicators to confirm trend validity. This helps filter false signals and improve trade accuracy.
The indicator provides clear visual trend identification with color-coded signals, offers dynamic stop-loss levels that adapt to volatility, works on all timeframes and currency pairs, helps traders stay aligned with the dominant trend, reduces false signals compared to simple moving averages, and is suitable for both trend-following and trend-reversal strategies when combined with other tools.
14 Downloads
Published:
Dec 13, 2025 00:34 AM
Category: