Riding the Waves of Momentum: A Guide to Moving Average Ribbons for MT5
In technical analysis, single moving averages often fail to tell the whole story. They can leave traders vulnerable to false breakouts or premature exits during complex market cycles. To truly understand market velocity and trend depth, professional traders look at multiple layers of timeframes simultaneously. For MetaTrader 5 (MT5) users, the Moving Average Ribbons indicator provides an elegant, all-in-one solution that visualizes Trend Strength, support structures, and momentum shifts in real time.
What are Moving Average Ribbons?
Moving Average Ribbons consist of a series of sequential moving averages plotted on the same chart. By stacking averages of increasing periods together, the indicator creates a dynamic, ribbon-like band that expands and contracts based on market volatility and trend alignment.
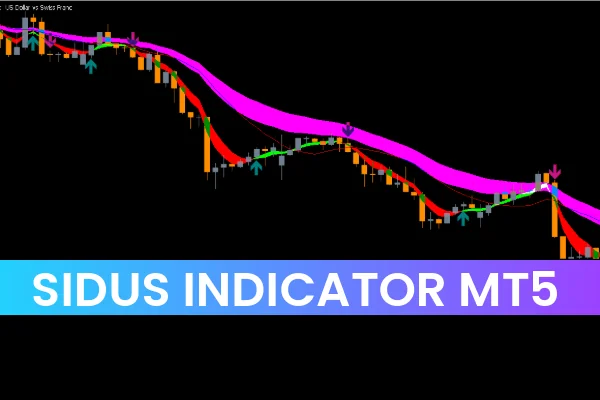
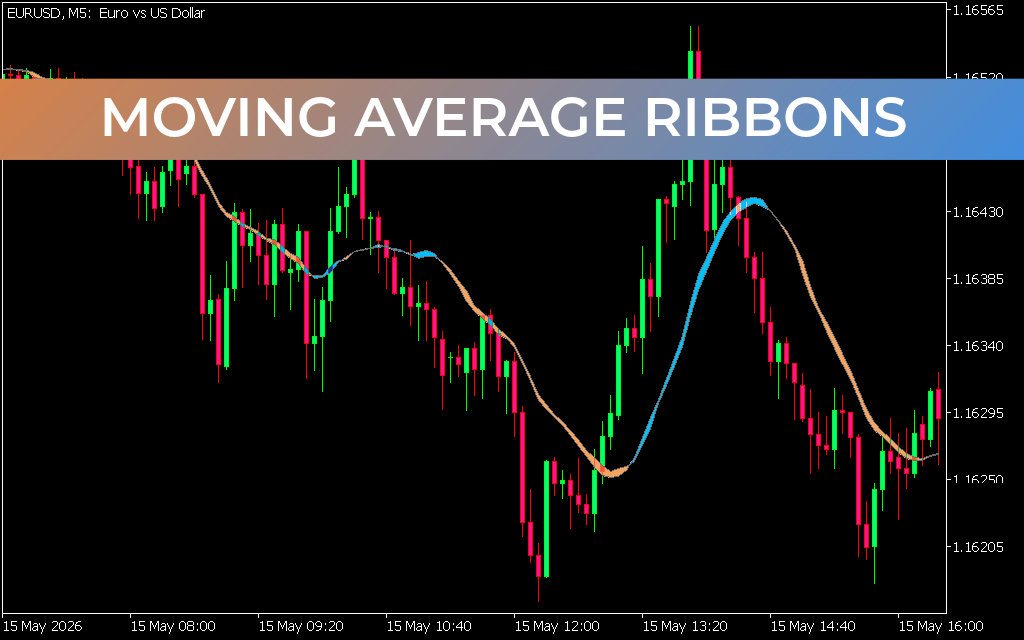
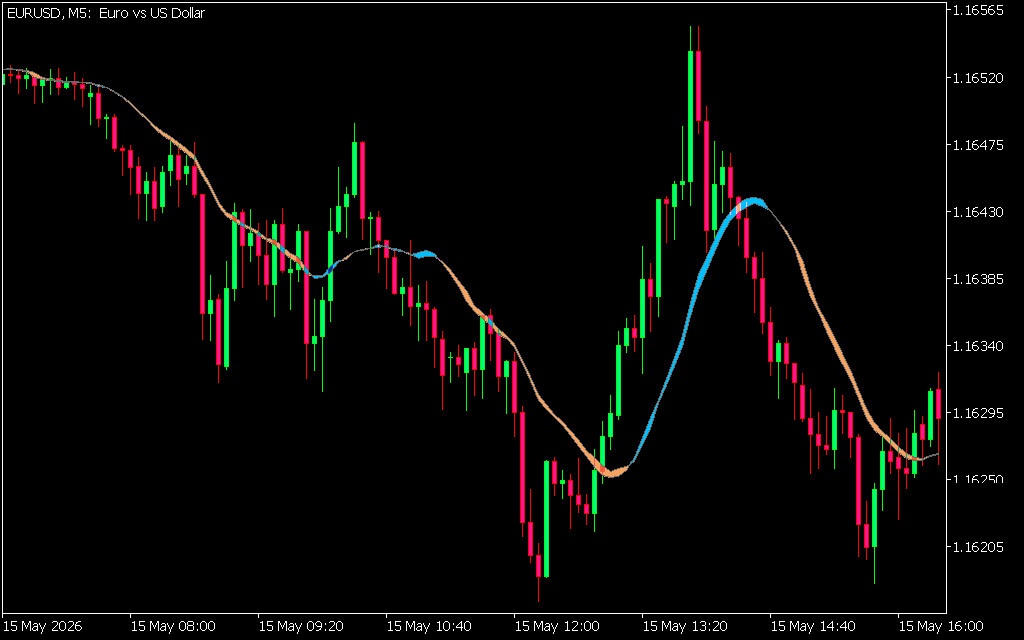
As demonstrated in the EURUSD M5 chart, this modernized MT5 version streamlines standard multi-line clutter by condensing the ribbon into a single, color-coded wave that changes color based on the dominant market force:
- Light Blue Ribbon: Indicates strong bullish momentum. During this phase, short-term moving averages are fanning out cleanly above longer-term ones, signaling a high-probability buy environment.
- Peach/Orange Ribbon: Signals strong bearish momentum. Here, short-term averages cross and expand below the long-term lines, confirming an optimal sell environment.
- Gray/Neutral Ribbon: Represents contraction or a transitioning market where the moving averages are tightly compressed or overlapping. This serves as an early warning to avoid low-probability setups.
Strategic Breakthroughs with Ribbon Trading
The strength of the Moving Average Ribbons for MT5 lies in its multi-layered predictive capabilities:
- Visualizing Trend Depth: When a trend is robust, the ribbon expands in width. This widening structure shows that all underlying timeframes are in agreement. As seen on the M5 chart, entering a short trade precisely as the ribbon transitions from gray to peach and expands allows you to catch the maximum depth of an intraday decline.
- Dynamic Support And Resistance: Instead of treating support as a single fixed line, the ribbon acts as a flexible zone. During strong trends, notice how price pullbacks are frequently absorbed by the edges of the ribbon before bouncing back in the direction of the dominant trend.
- Catching Massive Breakouts: The most profitable moves often occur right after a compression phase. When the ribbon squeezes tightly together into a narrow band, it indicates a bottleneck in market volume. A sharp price break followed by the ribbon fanning open into a bright color marks the birth of a major market breakout.
Optimized for the Advanced MT5 Architecture
Running multiple moving averages simultaneously can bog down older trading terminals. The Moving Average Ribbons indicator is built specifically for MT5, leveraging its multi-threaded processing engine to calculate tick data across all embedded periods instantaneously. This ensures your charts update smoothly without lag, giving you a distinct execution edge during high-volatility trading sessions.
Conclusion
The Moving Average Ribbons for MT5 upgrades a time-tested methodology into a clean, modern visual powerhouse. By revealing the underlying structure of a trend at a single glance, it removes emotion and simplifies execution. Add this indicator to your MT5 te
2 Downloads
Last Update:
May 16, 2026 03:06 AM
Published:
Jan 21, 2026 14:16 PM
Category: