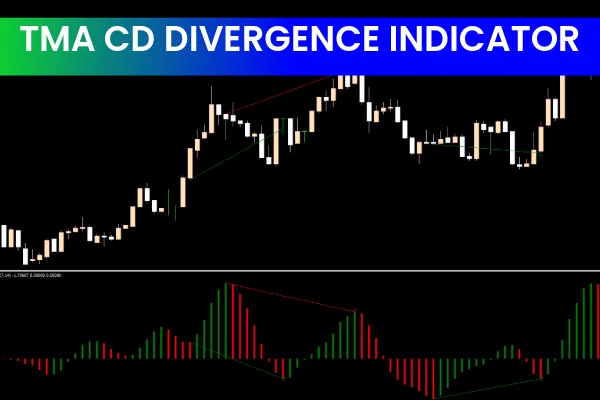
The TMA CD Divergence Indicator for MT5 detects bullish and bearish divergences using a triangular moving average oscillator and clear Buy/Sell arrows. Ideal for swing, intraday, and long-term Forex traders.
The TMA CD Divergence Indicator is a powerful MT5 trading tool that uses a triangular moving average (TMA) oscillator to automatically detect divergences between price and momentum. It helps traders spot early reversal opportunities by comparing price movement with a TMA line built from the difference between a fast SMA and a slow SMA.
Although divergence trading is traditionally complex, this indicator simplifies the entire process with easy-to-read histogram bars and clear BUY/SELL arrows—making it suitable for beginners and advanced Forex traders alike.
The indicator works smoothly on all currency pairs and all MT4/MT5 timeframes, making it useful for swing traders, day traders, and long-term position traders.
How the TMA CD Divergence Indicator Works
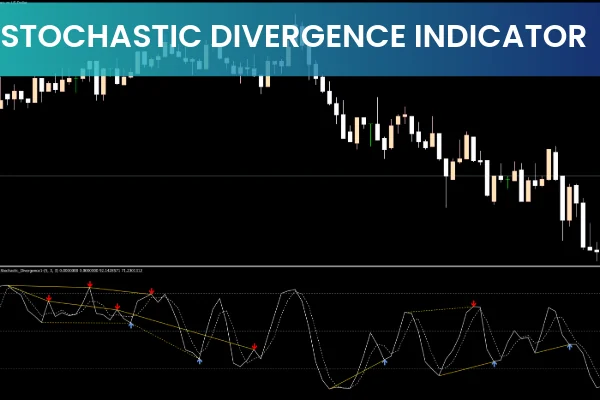
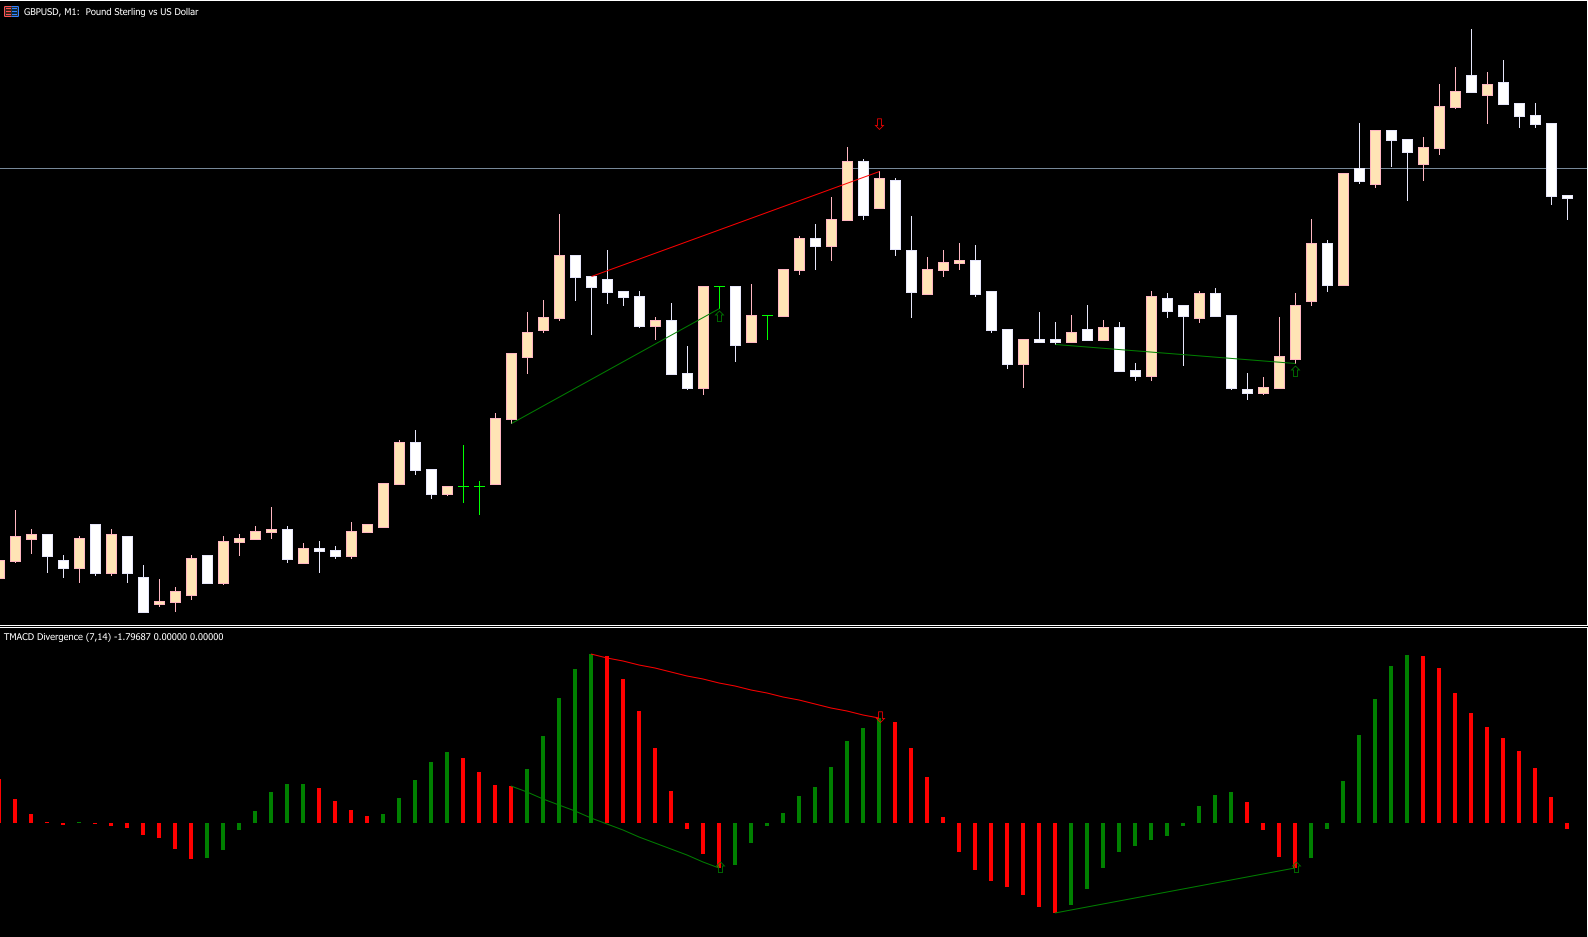
The indicator plots a colored histogram beneath the chart:
Green bars → Bullish momentum (potential upward trend)
Red bars → Bearish momentum (potential downward trend)
Once a divergence forms between price and the TMA line, the indicator prints an arrow directly on the chart:
Green arrow (BUY) → Bullish divergence detected
Red arrow (SELL) → Bearish divergence detected
This makes divergence trading extremely straightforward even for new traders.
How to Trade With the TMA CD Divergence Indicator
Below is the typical strategy used when interpreting TMA CD Divergence signals:
BUY Setup – Green Divergence Arrow
Wait for a green arrow to appear (bullish divergence).
Confirm with a secondary signal (e.g., bullish candle pattern, support level, or trendline bounce).
Set Stop Loss below the previous swing low.
Take Profit at your preferred risk-to-reward ratio or when the indicator gives an opposite signal.
SELL Setup – Red Divergence Arrow
Look for a red downward arrow (bearish divergence).
Confirm with Price Action (e.g., bearish engulfing, resistance rejection).
Set Stop Loss above the previous swing high.
Take profit once your risk-reward target is reached or at the next opposite signal.
Customizing the Indicator
You can adjust:
Fast and slow MA periods → reduces false signals or increases sensitivity
Color settings → match your personal MT5 chart theme
This makes the indicator fully flexible for any trader’s strategy.
Conclusion
The TMA CD Divergence Indicator for MT5 is a simple yet highly effective divergence-trading tool. It visually identifies bullish and bearish divergences using clear arrows, allowing traders to catch early trend reversals with ease.
FAQ
5 Downloads
Published:
Dec 10, 2025 04:38 AM
Category: