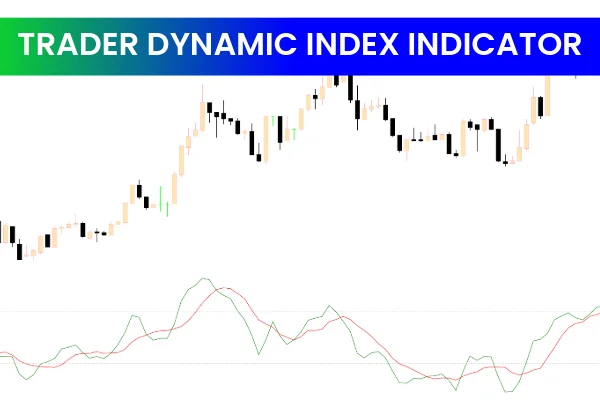
The Traders Dynamic Index indicator (TDI) is a widely used MetaTrader 5 tool built by combining several powerful indicators into one dynamic system. Designed as both a momentum and trend-following indicator, it gives traders a complete view of market volatility, Trend Strength, market direction, and potential reversal zones.
Because it merges multiple technical analysis tools into one visual framework, the TDI is considered one of the most versatile market assessment indicators in the trading industry. Traders use it for intraday, swing, and even Scalping strategies to determine high-probability buy and sell setups.
To explore more charting tools and trading indicators, visit IndicatorForest.com, where high-performance MT4 and MT5 indicators are available for professional and beginner traders.
Elements of the Traders Dynamic Index Indicator
The Traders Dynamic Index indicator integrates three major technical components. Each carries out a unique function but works together to create a detailed picture of market conditions.
Moving Average (Market Baseline)
The moving average helps reveal the overall trend direction. When the TDI lines remain above this baseline, the market is generally bullish; when below, it is bearish. This makes trend identification faster and more reliable.
Relative Strength Index (RSI)
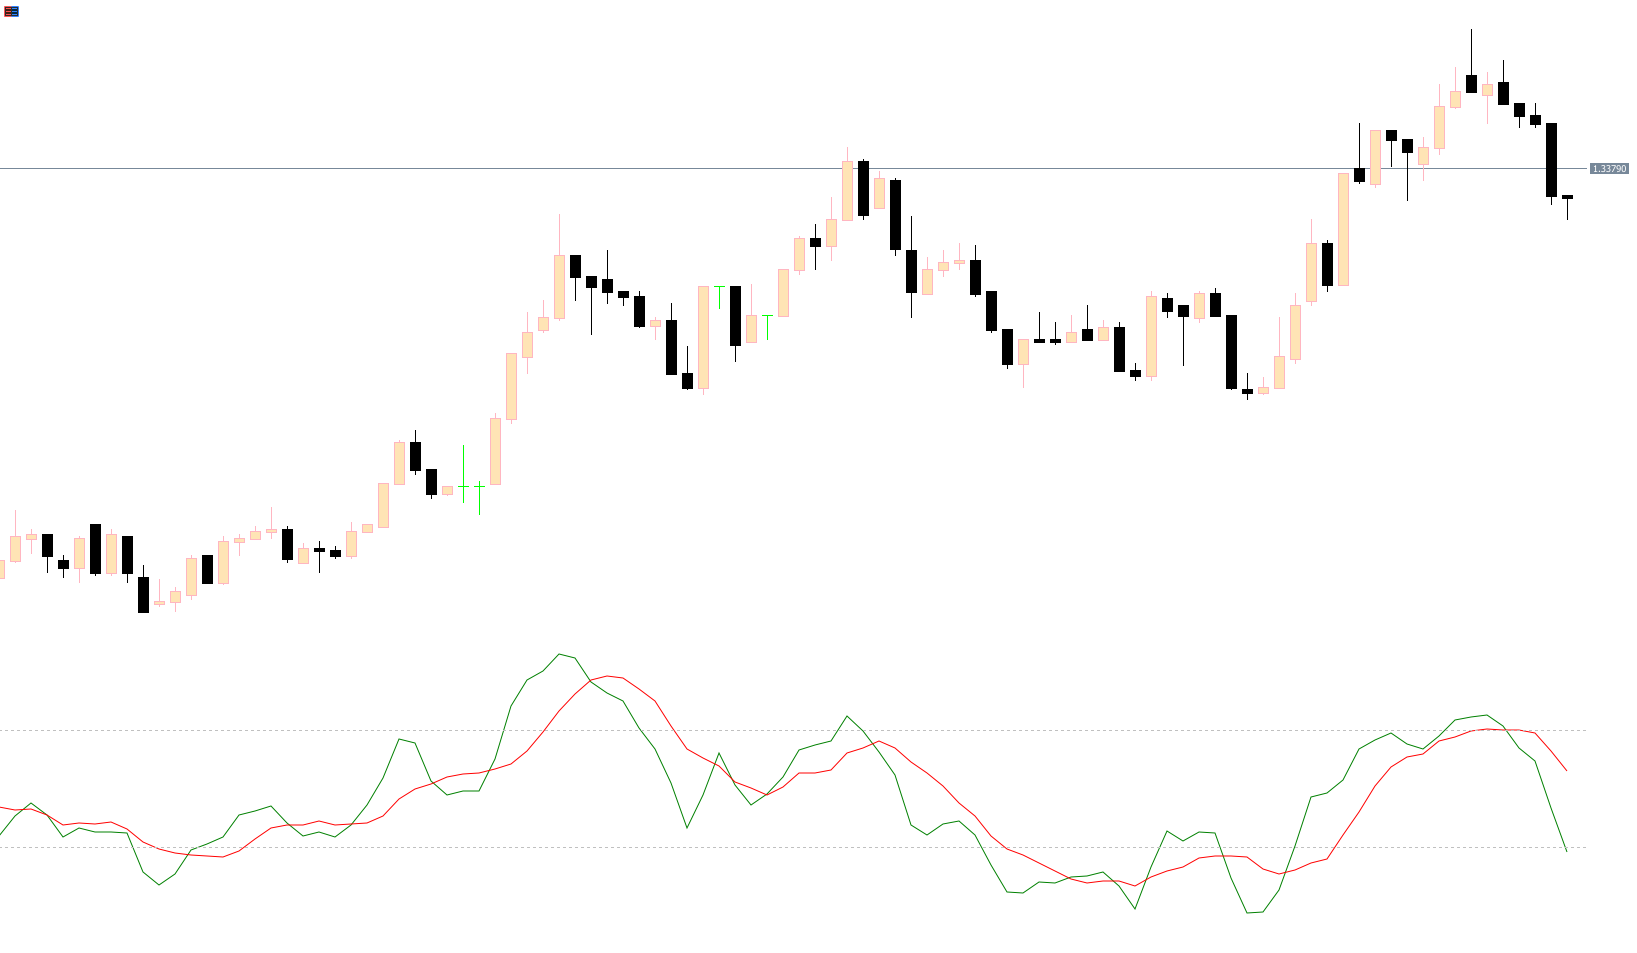
The RSI portion of the indicator—the green line—measures momentum, highlighting the speed and magnitude of price changes. It helps identify whether an asset is gaining strength or weakening.
Bollinger Bands
The upper and lower volatility bands (blue) illustrate market volatility. They also mark overbought and oversold zones. When the green RSI line pushes beyond these bands, traders expect strong market movement or possible exhaustion.
Why the TDI Indicator Is Valuable
The Traders Dynamic Index indicator is especially powerful because it eliminates the need to load several separate indicators. Instead, it merges each component into a single window, offering a unified view of:
Trend strength
Momentum direction
Volatility
Price exhaustion levels
Potential reversal points
This saves time, reduces chart clutter, and enhances clarity for both beginner and professional traders.
How to Trade with the Traders Dynamic Index (TDI) Indicator
Understanding the TDI Lines
Green line: RSI price line
Red line: Trade signal line
Blue lines: Volatility Bollinger Bands
Yellow line: Market baseline (MA)
Buy Signal Setup
A buy trade is triggered when:
The green RSI line and red signal line cross above the yellow baseline
Momentum shows upward strength
The green line moves away from oversold levels
Stop placement: below the most recent swing low
Profit target: based on risk-to-reward or key price resistance levels
Sell Signal Setup
A sell trade occurs when:
The green and red lines cross below the yellow baseline
Momentum weakens
The green RSI line moves away from overbought territory
Stop placement: above the recent swing high
Profit target: next support zone or predefined reward ratio
Additional Ways to Use the TDI Indicator
Scalping
TDI is highly effective for scalpers due to:
Fast line crossovers
Clear volatility signals
Immediate momentum reading
Intraday & Day Trading
Traders can use TDI to:
Confirm trend direction
Identify reversals earlier
Avoid trading during low-volatility conditions
Swing Trading
The combination of RSI + MA + Bollinger Bands provides deep insight into:
Trend continuation
Trend exhaustion
Longer-term reversal patterns
Conclusion
The Traders Dynamic Index indicator for MT5 is a robust, multi-functional trading tool that blends volatility, momentum, and trend analysis into one clean visualization. Whether used alone or alongside other indicators, TDI helps traders identify scalping, intraday, and swing trading opportunities with clarity and confidence.
For more professional-grade MT4 and MT5 indicators, visit IndicatorForest.com and upgrade your analysis toolkit.
FAQ
3 Downloads
Published:
Dec 10, 2025 22:05 PM
Category: