Maximize Your Trading Potential with the ASI Indicator V1 for MT4
In the world of professional Forex trading, staying ahead of market momentum is the key to consistent profitability. The ASI Indicator V1 (Accumulative Swing Index) is a powerful technical analysis tool designed for the MetaTrader 4 (MT4) platform that helps traders uncover the "true" Price Action of the market. By filtering out the noise of minor price fluctuations, the ASI provides a clearer picture of long-term trend strength and potential exhaustion points.
What is the ASI Indicator V1?
The ASI Indicator V1 is a derivative of the classic Accumulative Swing Index, originally developed by Welles Wilder. This indicator assigns a numerical value to each price movement to determine its significance. Unlike a standard price chart that only shows open, high, low, and close, the ASI mathematically connects these points to show the real direction of the market "swing."
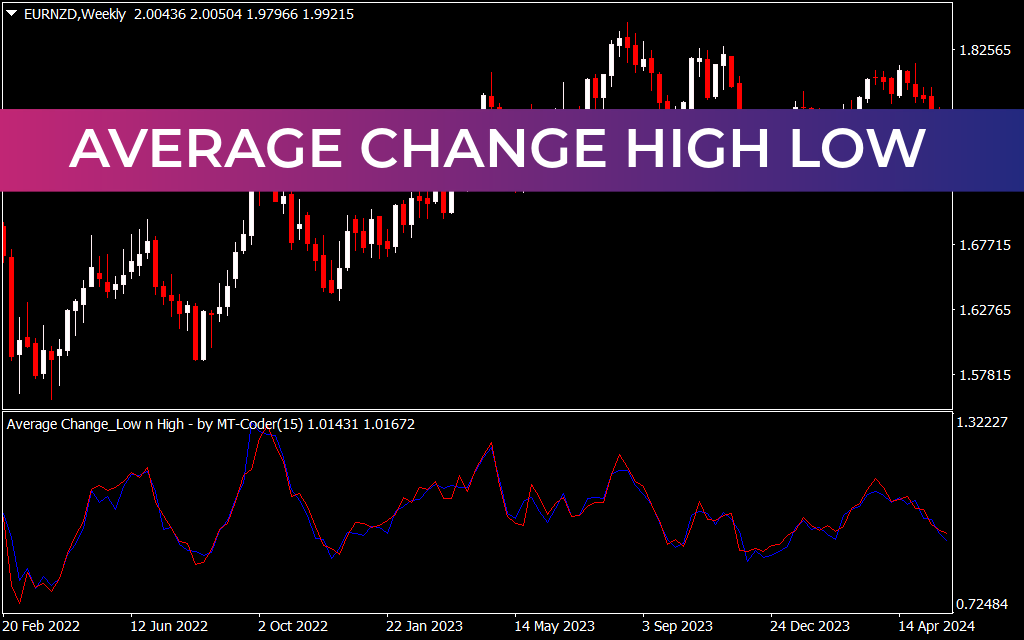
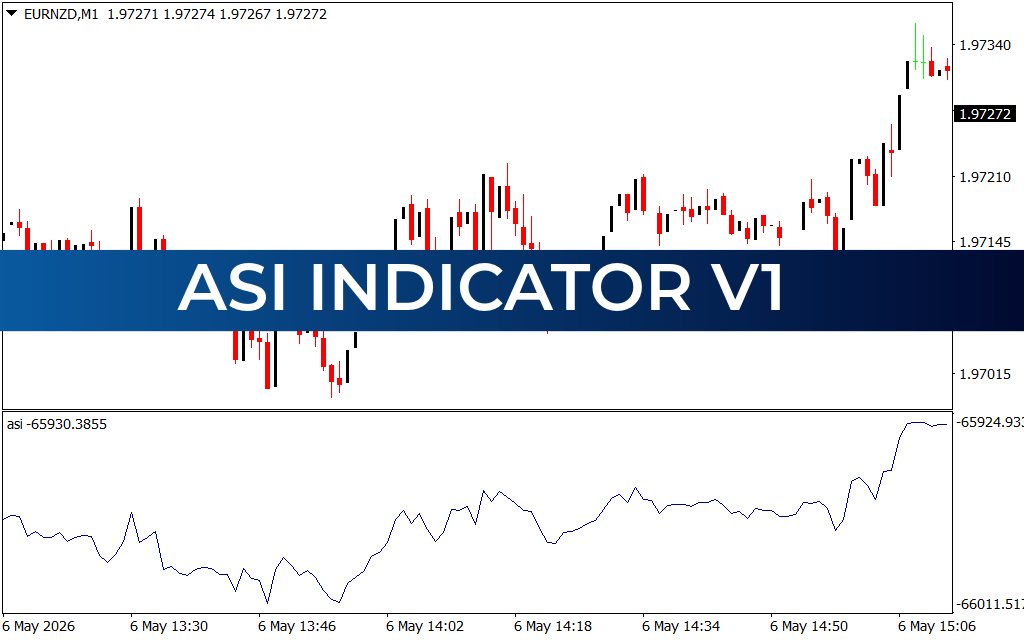
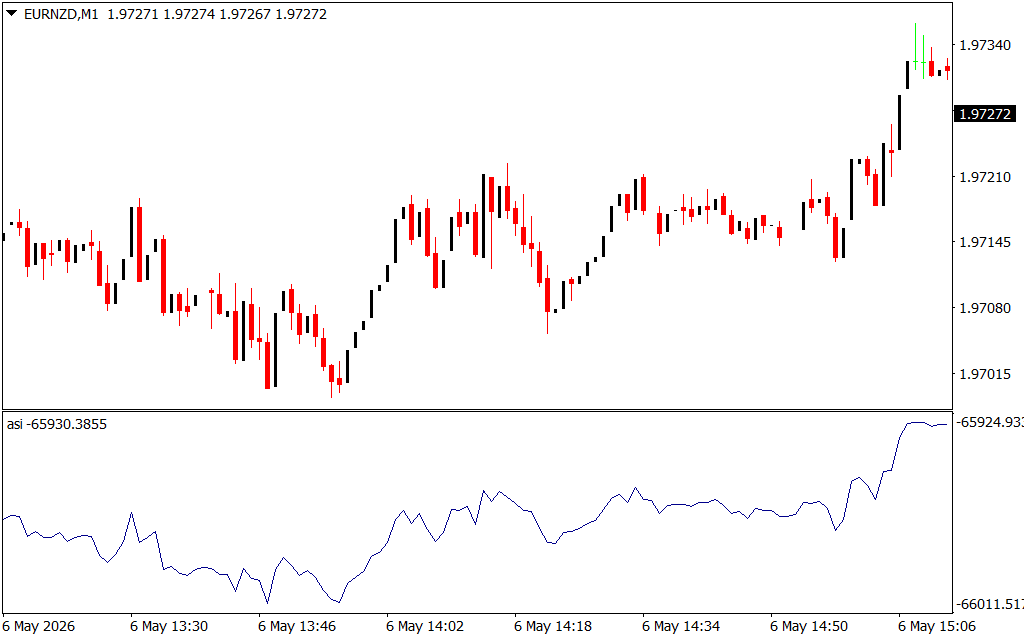
As observed in the recent market data for the EURNZD M1 timeframe, the ASI appears in a separate indicator window as a continuous blue line. This line mirrors price action but provides a smoother representation, making it easier to spot trend continuations and divergences.
Key Features of ASI Indicator V1
- Precision Trend Filtering: The ASI V1 is engineered to ignore insignificant price movements, allowing you to focus on high-probability trend shifts.
- Divergence Spotting: One of the strongest uses of this tool is identifying divergences. If the price of an asset like EURNZD makes a new high but the ASI line fails to do so, it signals a potential Trend Reversal.
- Breakout Confirmation: The ASI is highly effective at confirming price breakouts. If the ASI line breaks a previous resistance level before the price does, it provides an early entry signal for aggressive traders.
- Minimalist Design: The clean interface ensures your MT4 terminal remains uncluttered, providing essential data without distracting from the main price chart.
Trading Strategies for Success
To get the most out of the ASI Indicator V1, traders often look for Swing Point Breakouts. When the ASI line moves above a previous peak, it confirms that the uptrend has significant momentum behind it. Conversely, when the line drops below a previous trough, a bearish trend is likely underway.
Furthermore, because the ASI uses a mathematical formula that includes the previous session’s data, it is excellent for determining "limit" moves in the market. Traders can use the indicator to set more accurate stop-loss and take-profit levels based on the actual swing volatility of the currency pair rather than arbitrary pip counts.
Conclusion
The ASI Indicator V1 is an indispensable asset for any trader looking to move beyond basic chart patterns. It offers a deeper look into the mechanics of price movement, giving you the confidence to hold winning trades longer and exit losing ones faster. Whether you are Scalping the M1 chart or following daily trends, the ASI V1 provides the analytical edge required for modern financial markets.
1 Download
Last Update:
May 06, 2026 20:36 PM
Published:
Jan 27, 2026 01:35 AM
Category: