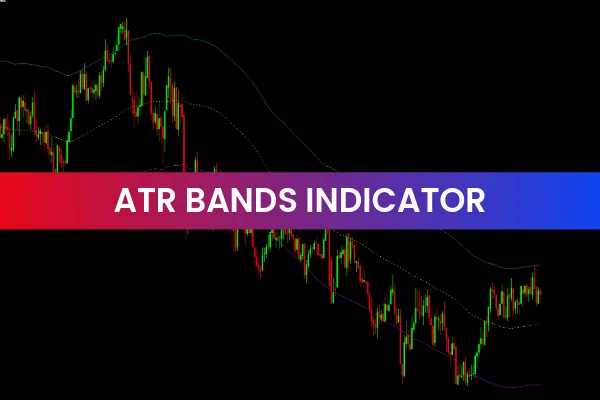
The ATR Bands Indicator for MT4 is a powerful and free Volatility Indicator that helps traders measure market volatility and identify key support and resistance levels. Unlike Bollinger Bands, which rely on standard deviation, the ATR Bands Indicator uses the Average True Range (ATR) to calculate the upper and lower bands, giving a more accurate picture of price movements and potential trading opportunities.
This versatile tool is suitable for traders of all levels, including beginners, intermediate, and advanced traders, and supports various trading styles such as Scalping, day trading, intraday trading, and swing trading.
How the ATR Bands Indicator Works
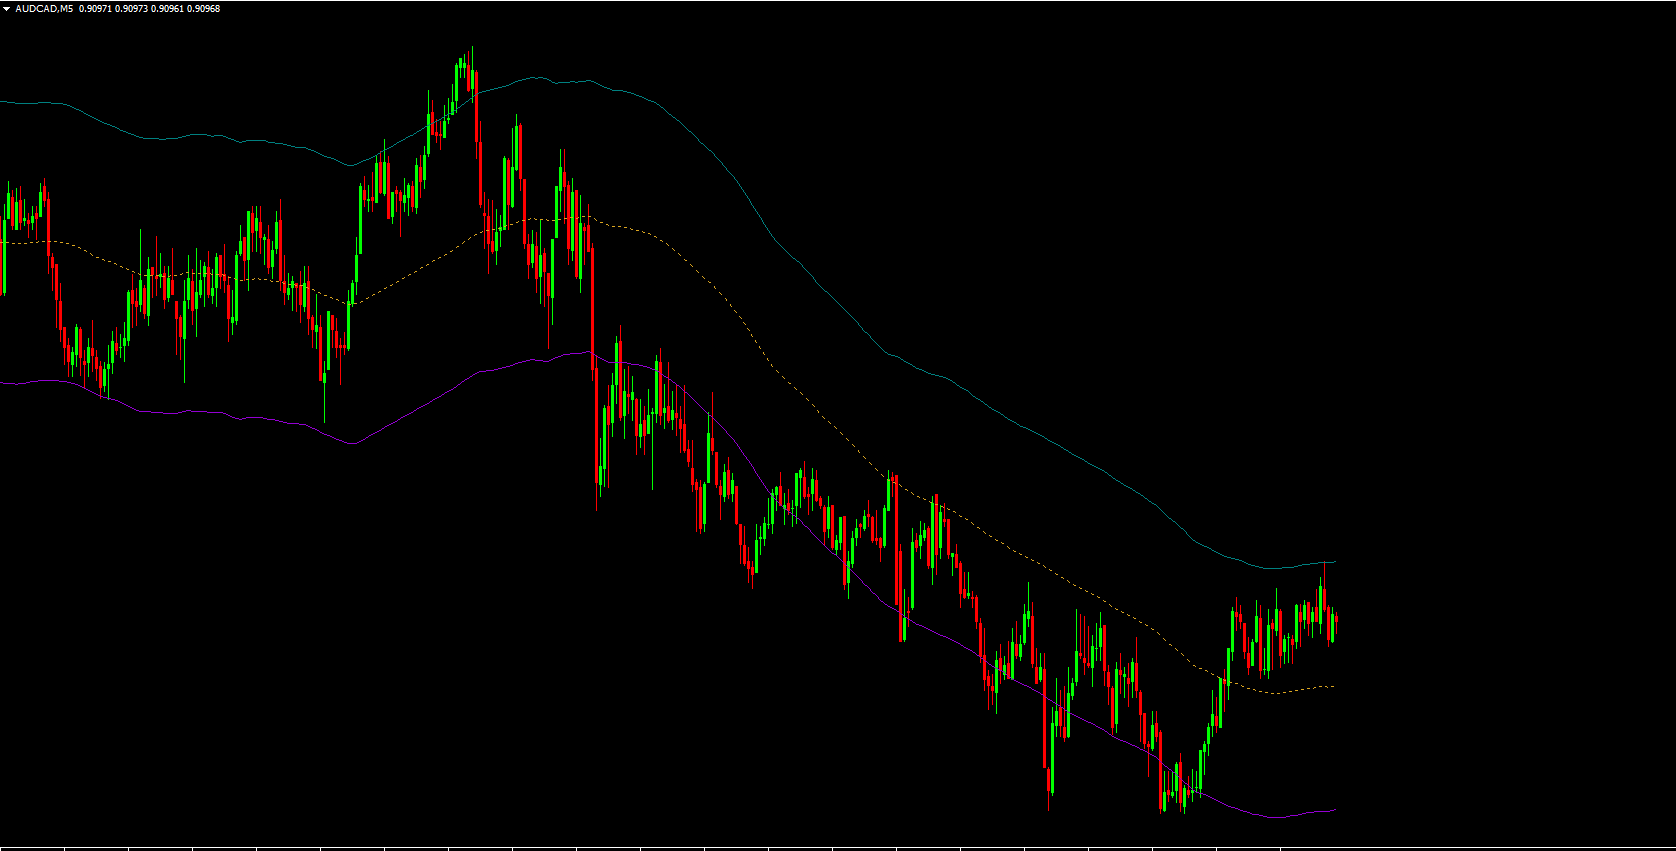
The ATR Bands Indicator works by plotting upper and lower bands around the price chart:
Upper Band: Represents the higher range of price based on ATR
Lower Band: Represents the lower range of price based on ATR
Band Expansion: Indicates increased market volatility
Band Contraction: Indicates decreased market volatility
By analyzing the expansion and contraction of the bands, traders can identify high-volatility periods, which may lead to strong price movements, or low-volatility periods, signaling consolidation or reduced market activity.
Key Features of the ATR Bands Indicator
The ATR Bands Indicator offers several features that make it a practical MT4 tool:
Volatility Detection: Shows periods of high and low volatility
Support And Resistance Identification: Upper and lower bands act as dynamic S/R levels
Trend Analysis: Helps traders understand the current market trend
Trend Reversal Detection: Expanding or contracting bands can indicate potential reversals
Customizable: Adjust ATR periods and band multipliers to suit trading style
Compatible with Multiple Timeframes: Suitable for scalping, intraday, and swing trading
These features make the ATR Bands Indicator a comprehensive volatility and trend analysis tool for Forex traders.
Benefits of Using the ATR Bands Indicator
The ATR Bands Indicator provides multiple benefits for traders:
Identify Optimal Entry and Exit Points: Helps pinpoint where to buy or sell based on volatility and price range
Understand Market Behavior: Highlights periods of expansion and contraction in price movements
Adapt to Different Trading Styles: Works across scalping, intraday, and swing strategies
Avoid False Signals: ATR-based calculation provides a more realistic measure of volatility compared to Bollinger Bands
Support Risk Management: Traders can place stop-loss and take-profit levels based on ATR band ranges
By using this indicator, traders can increase the accuracy of their trades, anticipate market swings, and better manage risk.
How to Use the ATR Bands Indicator Effectively
To use the ATR Bands Indicator effectively:
Look for price touching or breaking the upper band during strong uptrends for potential exit or reversal points
Watch for price approaching the lower band during downtrends for potential buy or reversal signals
Observe band expansion as an indicator of increasing volatility and possible Trend Continuation
Monitor band contraction for low-volatility periods, indicating consolidation or trend weakening
Combine with other MT4 indicators like RSI or MACD to confirm entry and exit points
This approach allows traders to maximize profits while minimizing risks using a reliable volatility-based method.
Why the ATR Bands Indicator Is Popular
The ATR Bands Indicator is popular because it provides clear and actionable insights into market volatility while highlighting support and resistance levels. Its reliance on Average True Range makes it more reliable than standard deviation-based tools like Bollinger Bands, and its flexibility makes it suitable for traders of all skill levels and styles.
Overall, the ATR Bands Indicator is an essential MT4 tool for Forex traders seeking to measure volatility, spot trends, and identify optimal trade opportunities.
Download the ATR Bands Indicator today from IndicatorForest.com and enhance your Forex trading strategy with accurate volatility analysis and trade signals.
FAQ
ATR Bands creates upper and lower envelopes around price using the Average True Range instead of standard deviation. These bands show a realistic range of movement based on current volatility.
Price reaching or exceeding the upper band during an up move can signal potential exhaustion or an area to take profits, while touches of the lower band in a down move can highlight similar zones. In strong trends, repeated band rides may instead confirm continuation.
Expanding bands indicate rising volatility and often accompany breakouts or strong trends. Contracting bands show quieter conditions and can warn that a big move may be building up after consolidation.
The indicator is effective on intraday and higher timeframes alike. Many traders choose H1 or H4 to balance responsiveness with smoother volatility behavior.
Trend tools such as moving averages and oscillators like RSI or stochastic can confirm whether a band touch is a likely reversal or just part of a strong ongoing move.
1 Download
Published:
Dec 18, 2025 02:25 AM
Category: