The ATR Candle Length Indicator is a popular and free Forex trading tool for the MetaTrader 4 (MT4) platform. It is designed to help traders measure the length of each candle on the chart, providing valuable insights into market trends, Trend Strength, and potential reversals.
By analyzing candle lengths, traders can gain a better understanding of market volatility and identify periods when strong price movements are likely. The indicator is highly versatile and can be used by both beginner and experienced traders.
How the ATR Candle Length Indicator Works
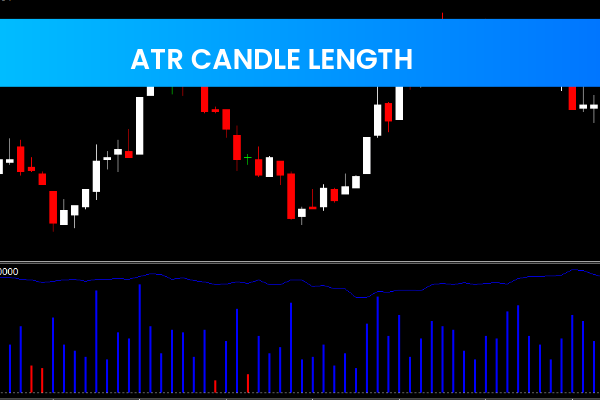
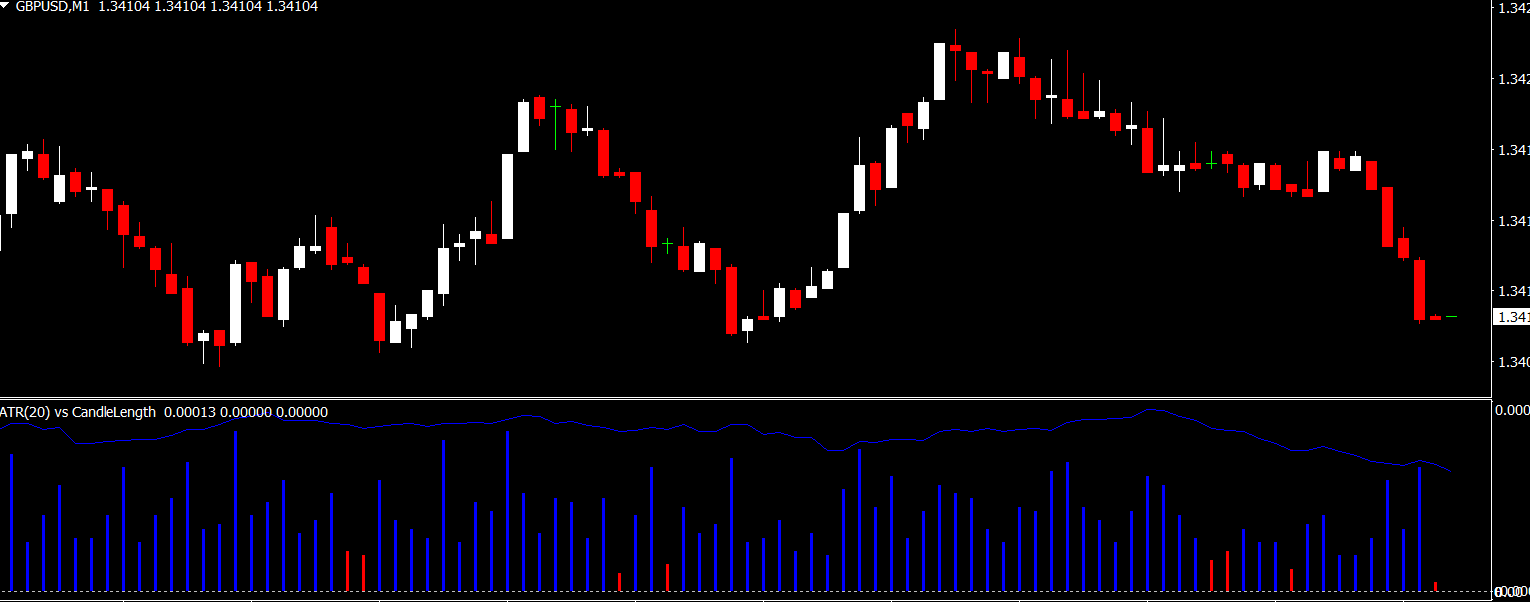
The indicator calculates the length of each candle and displays it in a histogram on the chart. Candle length is measured using the Average True Range (ATR) method, which provides an accurate representation of volatility.
Longer Candles: Suggest strong market momentum and a trending market.
Shorter Candles: Indicate weaker momentum or a potential consolidation phase.
Sudden Changes in Candle Length: Can signal potential market reversals.
By monitoring the histogram, traders can quickly spot changes in market behavior and make informed trading decisions.
Key Features
Candle Length Analysis: Measures each candle’s length using the ATR method.
Trend Identification: Helps determine whether the market is trending or consolidating.
Reversal Detection: Alerts traders to potential trend reversals.
Free and Easy to Use: Simple installation on MT4 with minimal setup required.
Visual Histogram: Provides a clear and intuitive representation of candle lengths.
Benefits of Using ATR Candle Length MT4
Quickly identify trending markets and periods of strong price movement.
Detect potential reversals before they occur.
Gauge the strength of a trend to make better trading decisions.
Ideal for scalpers, day traders, and swing traders who rely on Price Action.
Free to download and compatible with all MT4 charts.
How to Use the ATR Candle Length Indicator
Attach the indicator to your MT4 chart.
Observe the histogram to see the length of each candle.
Longer candles suggest a strong trend; shorter candles suggest consolidation.
Look for sudden increases or decreases in candle length as potential reversal signals.
Combine with other indicators like Moving Averages or RSI for trend confirmation.
FAQ
4 Downloads
Published:
Dec 22, 2025 04:22 AM
Category: