Master Volatility with the ATR Value Indicator
In the world of professional trading, volatility isn't just noise—it is a vital metric for survival. While many traders focus solely on entry price, the most successful market participants focus on how the price moves. The ATR Value Indicator is a critical technical tool designed to quantify market volatility in real-time, helping you set smarter stop-losses and more realistic profit targets.
What is the ATR Value Indicator?
The Average True Range (ATR) is a non-directional Volatility Indicator originally developed by J. Welles Wilder Jr. Unlike oscillators that tell you when a market is overbought, the ATR measures the "true range" of price movement over a specific period. The ATR Value Indicator takes this complex calculation and presents it as a clear, numerical value directly on your chart, removing the need for manual estimation.
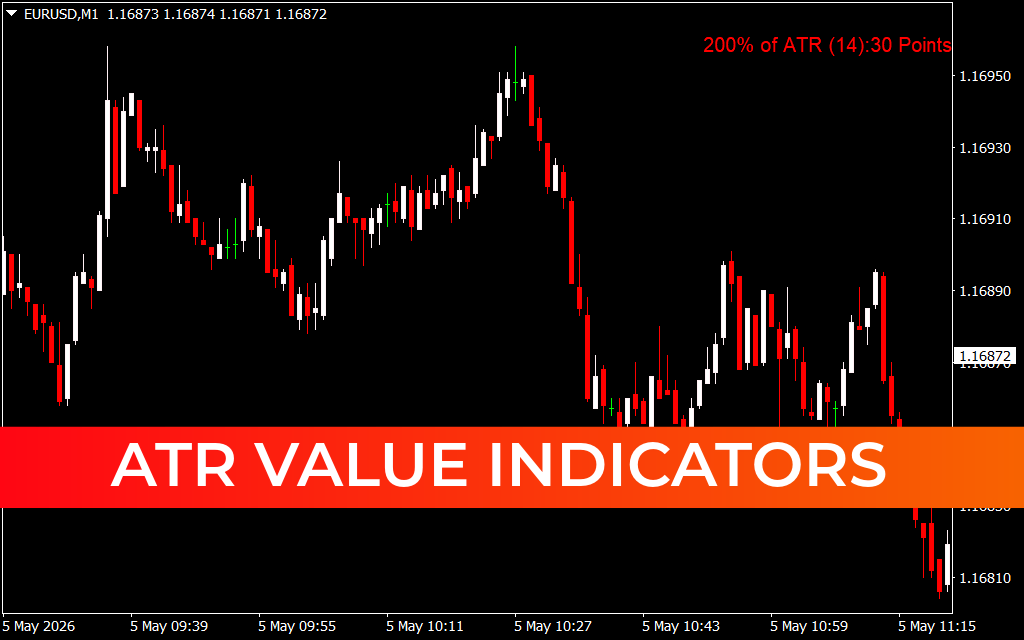
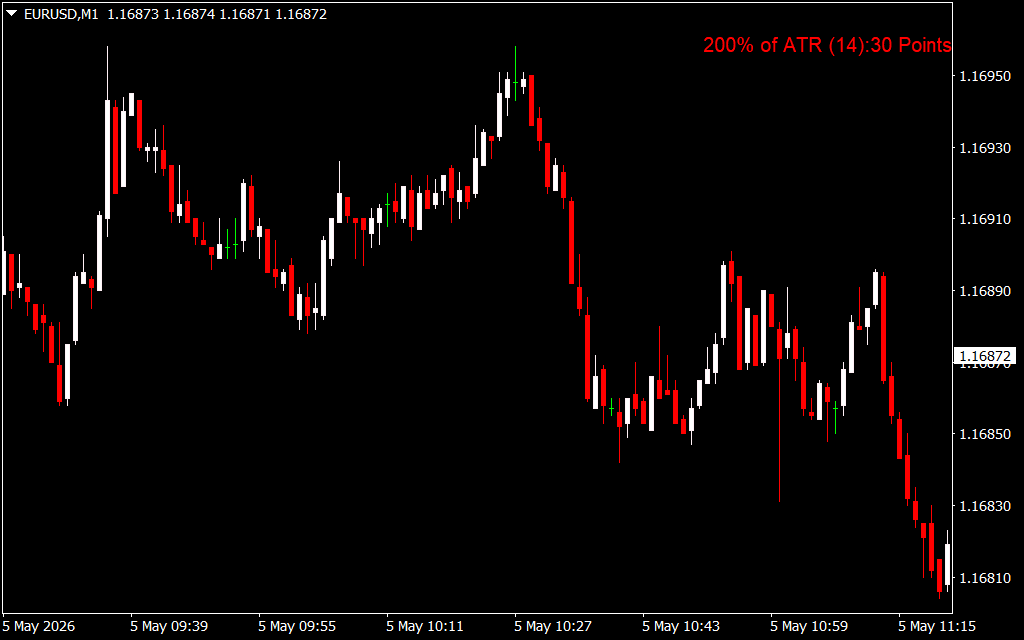
As seen in the provided image, the indicator displays essential data in a clean on-screen text format (e.g., "200% of ATR (14): 30 Points"). This real-time update allows you to see the average "heartbeat" of the market on your specific timeframe, such as the M1 chart shown in the example.
Key Features and Benefits
- Objective Volatility Measurement: It provides a mathematical value for price movement, allowing you to distinguish between a "quiet" market and a high-energy breakout.
- Dynamic Stop-Loss Placement: Many professionals use a "multiple" of the ATR (like the 200% shown in the chart) to set stop-losses. This ensures your stops are wide enough to breathe during high volatility but tight enough to protect capital when the market is calm.
- Realistic Target Setting: By knowing the ATR Value, you can set Take Profit levels that the market is actually capable of reaching within your chosen timeframe.
- On-Chart Display: By placing the value in the corner of your screen, the indicator saves valuable chart space, keeping your workspace clean and focused on Price Action.
How to Trade with the ATR Value Indicator
The ATR Value Indicator is the ultimate "filter" for any trading strategy. For example, if you are a scalper on the M1 chart, knowing the ATR is 30 points (as seen in the image) tells you that a 50-point target might be unrealistic for a quick trade.
Furthermore, it is an essential tool for Trend Following. During a strong trend, volatility often increases. If the ATR value begins to spike significantly beyond its average, it may signal a "climax" or a period of exhaustion, alerting you to tighten your trailing stops before a potential reversal occurs. Conversely, a very low ATR value indicates a "squeeze," which often precedes a massive market breakout.
Why Every Trader Needs ATR Value
Technical trading is about managing risk. If your stop-loss is fixed (e.g., always 20 pips), you will be stopped out prematurely when volatility rises. The ATR Value Indicator allows your strategy to "evolve" with the market. Whether you are trading major Forex pairs, gold, or indices, this indicator provides the data-driven clarity required to manage risk like a professional.
5 Downloads
Last Update:
May 05, 2026 15:48 PM
Published:
Jan 27, 2026 20:11 PM
Category: