The Envelope MA Forex Indicator for MT4 is a built-in technical analysis tool that helps traders identify potential price extremes, reversals, and stabilization zones. While visually similar to Bollinger Bands, the Envelopes indicator operates on a different assumption: that price tends to return to a balanced state after temporary abnormal movements caused by strong bullish or bearish pressure. Since the market spends most of its time in equilibrium, prices touching extreme levels of the Envelope bands can signal potential trading opportunities.
What Is the Envelope Forex Indicator?
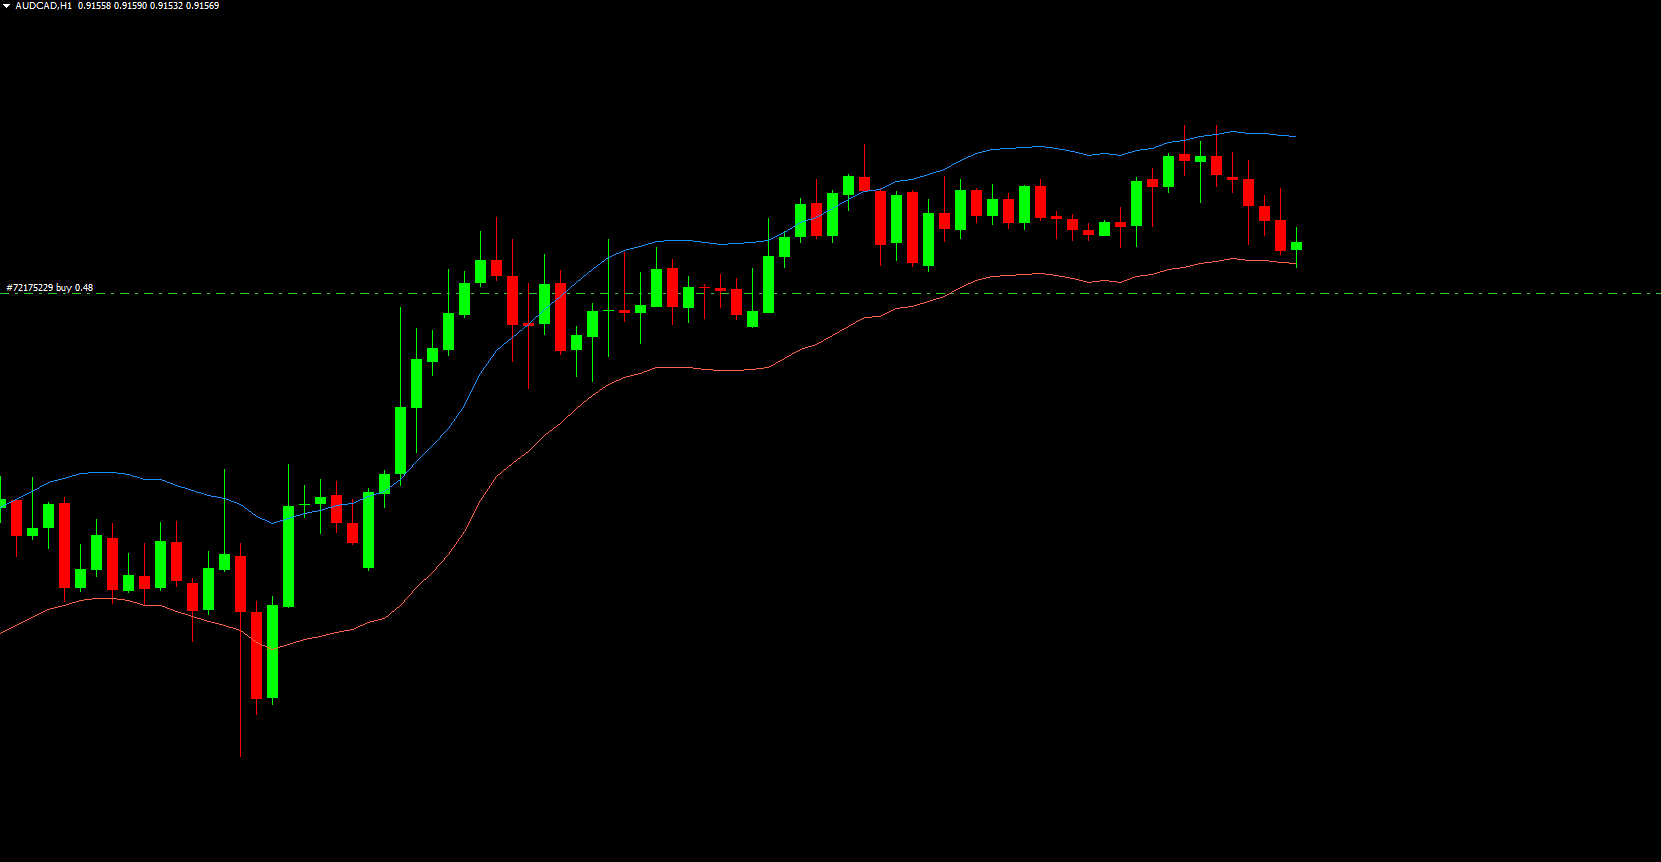
The Envelope indicator consists of two moving averages that create an upper and lower band, forming a price "channel." These bands adjust dynamically to market volatility, showing potential overbought and oversold areas. Unlike Bollinger Bands, which use standard deviation, the Envelopes indicator typically uses a percentage-based deviation.
On MT4, the default settings apply a 14-period moving average with a 0.1% deviation, creating two parallel lines surrounding Price Action. This “tape-like” appearance makes it easy to spot when price moves outside the normal range.
How Does the Envelopes Indicator Work?
The Envelope bands change width depending on market conditions. When volatility increases, price may break above or below the bands—similar to Bollinger Band breakouts. These breakouts often signal that the market has moved too far too fast and may soon return to equilibrium.
Key Behaviors:
Price touching lower band: Potential oversold condition
Price touching upper band: Potential overbought condition
Price breaking outside the band: Possible Trend Continuation or exhaustion
Price returning inside the band: Possible reversal signal
Because the indicator is centered around moving averages, traders often add a middle line to act as a mean-reversion target for Take Profit placement.
How to Interpret the Envelopes Indicator
Trend Signals
A buy or sell signal is considered more reliable when the price moves outside the Envelope band. However, confirmation from complementary tools—like RSI, price patterns, or volume indicators—is highly recommended.
Range-Trading Signals
The Envelopes indicator performs best in sideways markets, where price oscillates between Support And Resistance.
Buy when price touches the lower band
Sell when price touches the upper band
Close a position if the band is broken
When price violates the band boundary, the Envelope acts like a price channel, indicating the potential for trend development or volatility expansion.
Important Advice
To reduce false signals, do not enter a trade immediately when price touches a band. Instead:
Wait for a break,
Then wait for price to re-enter the band from the opposite direction.
This technique helps filter out noise and increases the probability of success.
Envelope Settings and Best Practices
The standard deviation in Envelopes is based on % deviation rather than the statistical measure used in Bollinger Bands. When experimenting with the MT4 settings:
Deviations above 2% will create a channel that is too wide, reducing sensitivity.
A deviation range of 0.1% to 2% is preferred for balanced performance.
Additional Rules for Effective Envelope MA Trading
Use higher timeframes:
The indicator performs more reliably on M30 and above.
Wait for price confirmation:
At least one candle should close inside the band before executing a trade.
Use additional indicators:
RSI works excellently for confirming overbought and oversold conditions.
Place pending orders:
Take Profit: Middle of the Envelope channel
Stop Loss: 5 points above/below previous local highs or lows
These rules create a structured, risk-managed approach suitable for beginners and advanced traders.
Conclusion
The Envelope MA forex indicator for MT4 is a powerful, easy-to-use tool based on moving averages and designed to identify price extremes, reversals, and equilibrium zones. Although it resembles Bollinger Bands, it offers unique advantages in range-bound markets and mean-reversion strategies. Always combine Envelopes with additional indicators like RSI for improved accuracy.
For more advanced indicators and expert trading tools, visit IndicatorForest.com.
FAQ
The Envelopes MA Indicator displays moving average envelopes that create upper and lower bands around a central moving average. These bands help identify overbought and oversold conditions and potential trend reversals. When price touches the upper envelope, it may indicate overbought conditions, while touches to the lower envelope may suggest oversold conditions.
When price is above the upper envelope, it may signal overbought conditions and potential downward reversals. When price is below the lower envelope, it may indicate oversold conditions and potential upward reversals. Price moving between the envelopes suggests normal trading range, while breakouts may signal trend continuation.
Enter buy trades when price bounces off the lower envelope in an uptrend, and enter sell trades when price rejects the upper envelope in a downtrend. Breakouts beyond the envelopes may signal strong trend continuation. Always confirm with price action patterns, trend direction, or other technical tools to improve accuracy.
Moving average envelopes provide dynamic support and resistance levels that adapt to market volatility. Unlike fixed levels, envelopes adjust based on price movement, making them more responsive to changing market conditions. This dynamic nature helps identify overbought/oversold conditions more accurately than static levels.
The indicator works on all MT4 timeframes and currency pairs, making it suitable for scalping, intraday trading, and swing trading strategies. Many traders prefer using it on H1 and H4 charts where envelope signals are clearer, though it can also be effective on shorter timeframes when combined with proper confirmation.
Published:
Dec 14, 2025 15:03 PM
Category: