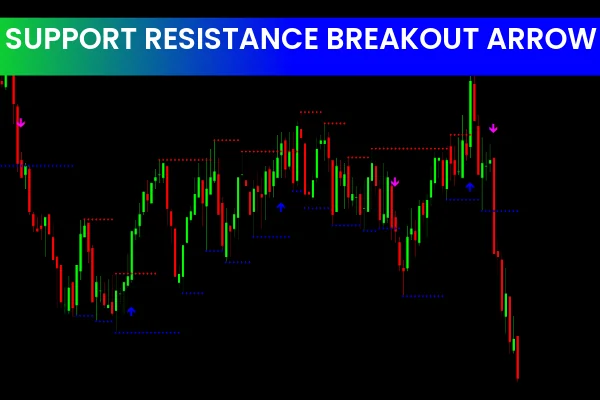
If you use a Breakout Trading Strategy, the Support Resistance Breakout Arrows Indicator for MT4 is an essential tool. This indicator automatically plots support and resistance levels and provides clear buy and sell breakout signals, making it easier for traders to identify strong trend opportunities.
By combining multiple technical tools, the indicator ensures accuracy and helps traders focus on high-probability trades, reducing time spent on manual analysis.
How the Support Resistance Breakout Arrows Indicator Works
This MT4 indicator uses a combination of Fractal, CCI (Commodity Channel Index), and RSI (Relative Strength Index) to generate breakout signals. The indicator automatically draws significant Support And Resistance levels on the chart, helping traders anticipate price action.
Blue arrows indicate a buy breakout signal.
Red arrows indicate a sell breakout signal.
The plotted support and resistance levels remain static once established, providing a consistent reference for trend analysis.
The indicator works across multiple timeframes but is most effective for day trading. Longer-term traders can also use H4, Daily, and Weekly charts to identify breakout opportunities.
Features of the Support Resistance Breakout Arrows Indicator
Automatic Support and Resistance Levels
The indicator automatically identifies key support and resistance zones without relying on pivot points. This saves time and enhances trading efficiency.
Clear Breakout Signals
Trade signals are displayed as blue or red arrows, representing potential market breakouts. This visual feature simplifies decision-making for traders.
Adjustable CCI and RSI Settings
Traders can filter signals by adjusting CCI levels and setting RSI thresholds for overbought and oversold conditions. This flexibility helps improve signal accuracy and reduce false breakouts.
Multi-Timeframe Compatibility
The indicator works across all chart timeframes, making it suitable for scalpers, intraday traders, and swing traders.
Benefits of Using the Support Resistance Breakout Arrows Indicator
Efficient Trend Identification
The plotted support and resistance levels, combined with breakout arrows, allow traders to quickly spot trend changes and act accordingly.
Simplifies Trade Entries
The indicator provides clear entry signals with visual arrows, eliminating guesswork and helping traders focus on execution.
Enhances Trend-Following Strategies
By signaling breakout points, the indicator supports trend-following strategies, enabling traders to enter the market at the beginning of new moves.
Reduces Analysis Time
Automatic plotting of support and resistance zones allows traders to focus on other aspects of their strategy, such as risk management and trade confirmation.
How to Trade Using the Indicator
Apply the indicator to an MT4 chart.
Observe the automatically plotted support and resistance levels.
Wait for a blue arrow (buy) or red arrow (sell) signaling a breakout.
Enter the trade following the Arrow Signal.
Place a stop-loss just below support for buys or above resistance for sells.
Use trend confirmation tools or Price Action analysis to optimize entries and exits.
By following these steps, traders can efficiently leverage breakouts for higher probability trades.
Conclusion
The Support Resistance Breakout Arrows Indicator MT4 is a powerful tool for traders seeking to identify breakouts, enter trades early, and follow trends confidently. Its automatic support/resistance plotting, clear arrow signals, and customizable settings make it suitable for Scalping, intraday, and swing trading.
For more MT4 indicators and trading tools, visit IndicatorForest.com.
FAQ
3 Downloads
Published:
Dec 11, 2025 09:50 AM
Category: