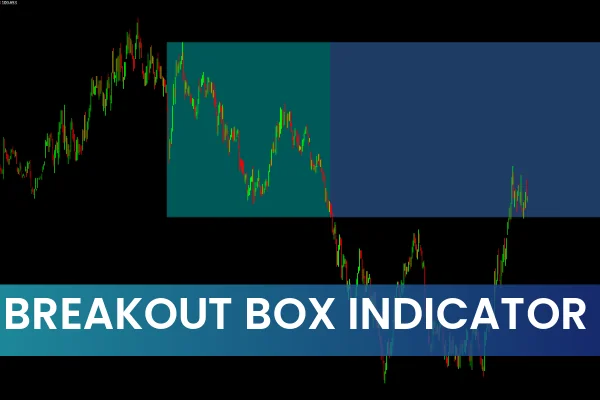
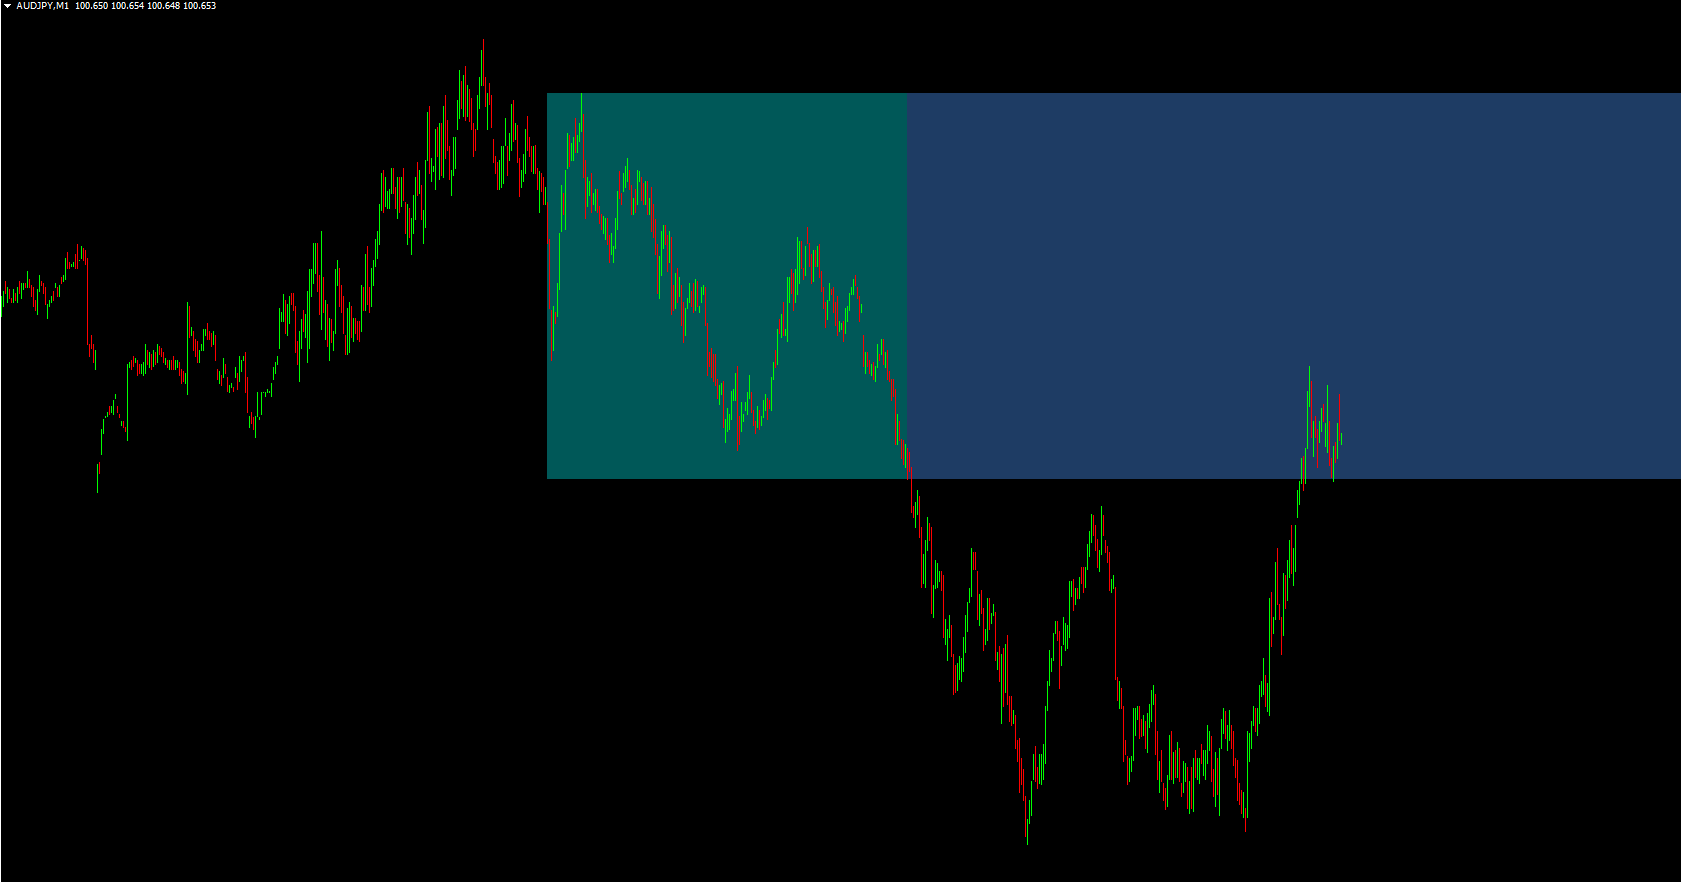
The Breakout Box Indicator for MetaTrader 4 is a powerful tool designed to help traders spot breakout opportunities in Forex. It automatically draws a rectangle around key support and resistance zones, making it easy to identify where the price may move next.
This indicator is ideal for timeframes below H4, with H1 being the most effective. It works across multiple trading styles, including Scalping, intraday, and day trading.
By visualizing crucial zones, the Breakout Box Indicator allows traders—both novice and expert—to anticipate market moves and make informed trading decisions without complex analysis.
How the Breakout Box Indicator Works
The indicator analyzes Price Action to determine significant Support And Resistance levels. Once identified, it draws a rectangular box around these zones:
Buy opportunities: Occur when the price breaks and closes above the resistance box in an uptrend.
Sell opportunities: Occur when the price breaks and closes below the support box in a downtrend.
This visual approach makes it easier to spot high-probability breakout trades, even for beginners who struggle to identify key market zones manually.
Breakout Box Indicator Trading Strategies
Trend-Based Breakout Trading
Study the overall market trend.
Wait for the price to break and close outside the breakout box in the trend direction.
Enter a BUY trade after a close above the box in an uptrend or a SELL trade after a close below the box in a downtrend.
Retest and Rejection Strategy (High Probability)
Wait for a candlestick to break out of the box.
Observe the next candlestick as it retests the box.
If the second candle shows a rejection (long wick) at the breakout zone, enter a trade in the breakout direction.
Logic:
A breakout followed by a rejected retest indicates a strong support/resistance zone, increasing the probability of a successful trade.
Combining with Candlestick Patterns
Enhance entries by using patterns like engulfing candles or pin bars.
This combination provides confirmation and higher confidence in breakout trades.
Pros and Cons of the Breakout Box Indicator
Pros
Easy to use: Visual representation of support and resistance zones.
Versatile: Works with scalping, intraday, and day trading strategies.
High-probability setups: Helps spot clean breakout opportunities.
Free to download: Available at IndicatorForest.com.
Cons
Timeframe limitations: Best for H1 and lower; not ideal for H4 or daily charts.
No direct signals: Requires price action analysis and trading discipline.
False breakouts: Like any tool, some breakouts may fail; proper risk management is essential.
Conclusion
The Breakout Box Indicator for MT4 is a must-have tool for Forex traders who want a visual roadmap of key market zones. While it doesn’t provide direct signals, it helps traders:
Identify high-probability breakout setups.
Anticipate market movement using support and resistance zones.
Improve entries and exits when combined with candlestick analysis or other indicators.
With proper money management and trading discipline, this free indicator can significantly improve your trading strategy.
Download the Breakout Box Indicator today at IndicatorForest.com and start spotting cleaner breakout trades.
FAQ
2 Downloads
Published:
Nov 11, 2025 03:49 AM
Category: