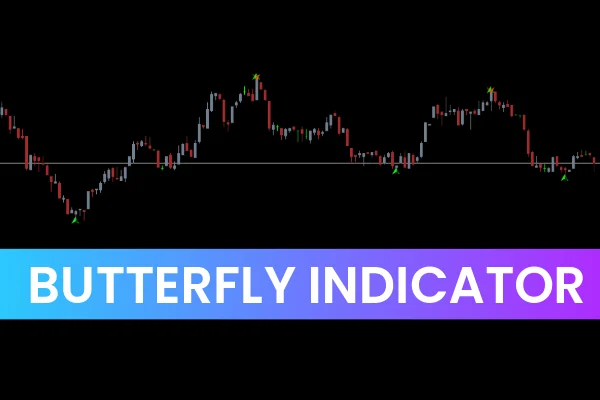
The Butterfly Indicator for MT4 is a custom harmonic pattern indicator designed to identify potential trend reversal zones in the Forex market. The Butterfly pattern, a classic formation in harmonic trading, is widely used by professional traders to pinpoint high-probability turning points. However, identifying this pattern manually requires detailed Fibonacci measurements and an experienced eye for geometric price structures — a process that can be time-consuming and prone to human error.
The Butterfly Indicator eliminates this complexity by automatically detecting and drawing Butterfly patterns directly on your MetaTrader 4 chart. With this smart tool, both beginners and advanced traders can spot trend reversals with confidence and precision.
What Is the Butterfly Pattern?
The Butterfly pattern is a four-leg harmonic formation that predicts potential market reversals at specific Fibonacci levels. It consists of five key points: X, A, B, C, and D. The D point represents the potential reversal zone (PRZ) where price is expected to reverse after completing the pattern.
In technical terms, the Butterfly pattern is an extension pattern — meaning the final leg (XA → AD) typically extends beyond the starting point (X). When the market reaches the D point, traders anticipate a reversal of the current trend.
This harmonic pattern can be bullish or bearish:
A bullish Butterfly forms at the bottom of a downtrend, signaling a potential upward reversal.
A bearish Butterfly forms at the top of an uptrend, signaling a potential downward reversal.
Because of its reliability in pinpointing turning points, the Butterfly pattern is especially popular among scalpers, intraday traders, and swing traders.
How the Butterfly Indicator for MT4 Works
The Butterfly Indicator for MT4 uses advanced algorithms to automatically scan the market for valid Butterfly harmonic formations. When it detects a valid pattern, it draws the pattern directly on the chart and marks the potential reversal zone (PRZ) using clear visual cues.
Unlike manual analysis, this automated tool does all the Fibonacci calculations and geometric projections instantly — ensuring that traders don’t miss opportunities due to delayed pattern recognition.
Once a pattern is detected, the indicator plots a buy or sell signal:
Buy Signal: Displayed below the candlestick when a bullish Butterfly forms (indicating a potential upward reversal).
Sell Signal: Displayed above the candlestick when a bearish Butterfly forms (indicating a potential downward reversal).
These visual alerts allow traders to react quickly and time their entries more effectively.
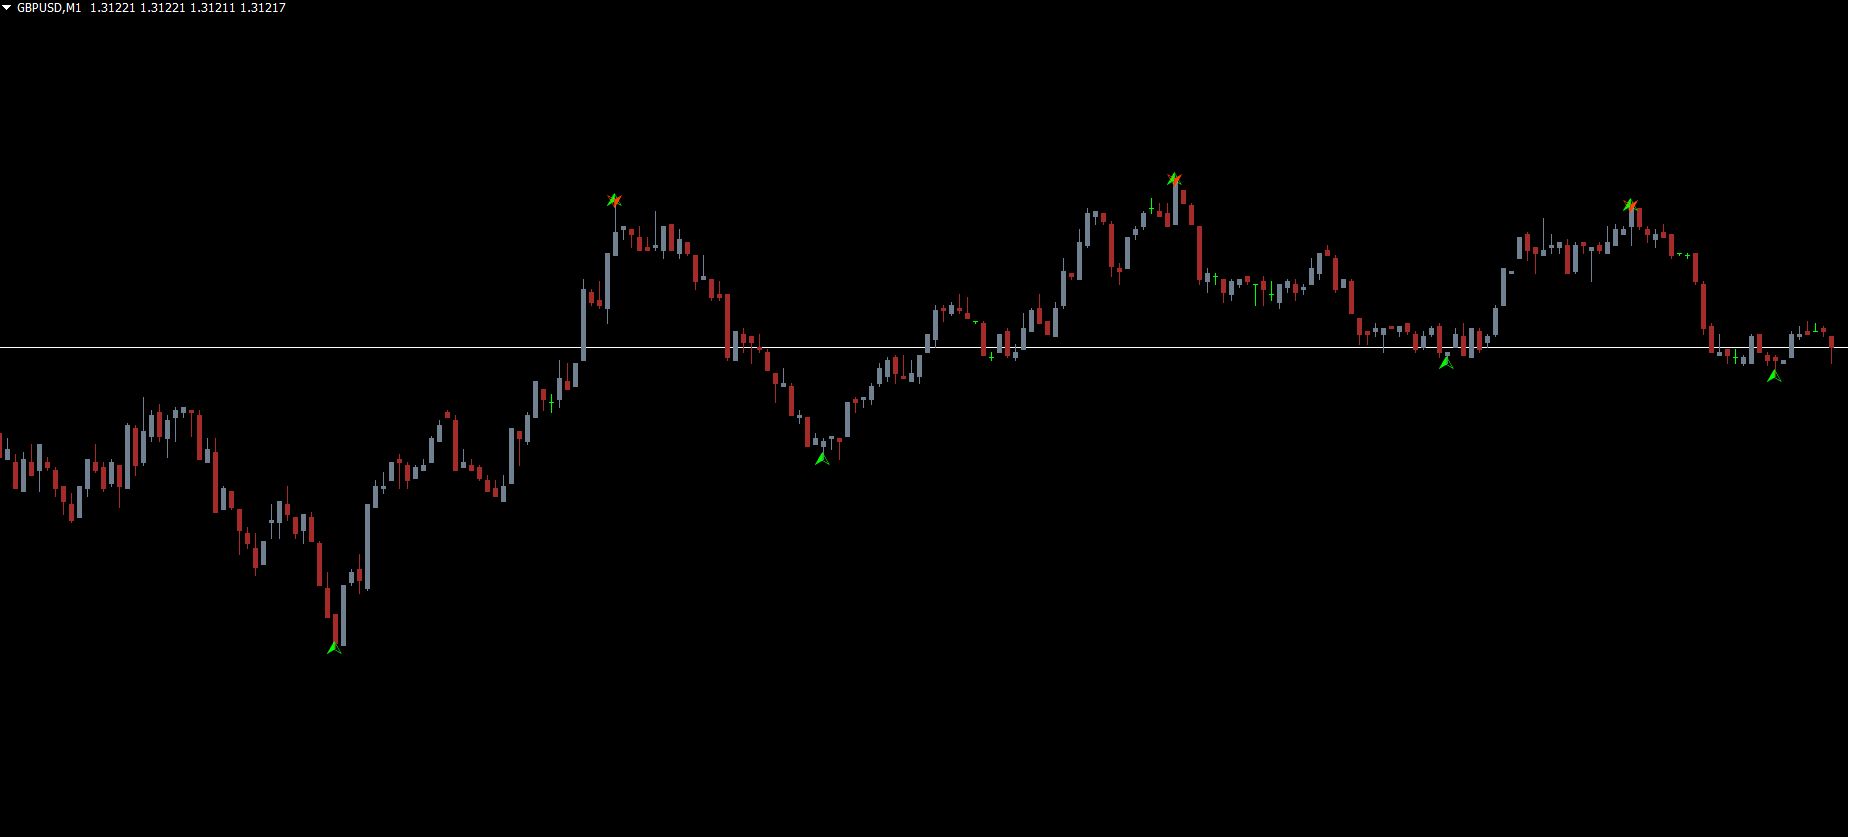
Trading with the Butterfly Indicator for MT4
The above EUR/USD chart shows the Butterfly Indicator identifying both bullish and bearish reversal setups.
To trade with this indicator:
Watch for the pattern completion: When a Butterfly pattern completes and the indicator displays a buy or sell signal, wait for confirmation from Price Action.
Confirm the reversal: Use a bullish engulfing candle, pin bar, or break of structure to confirm a bullish setup. For bearish signals, look for bearish engulfing or lower high formations.
Place trades strategically:
For buy trades, enter after confirmation and place the stop loss below point D of the Butterfly.
For sell trades, enter after confirmation and place the stop loss above point D.
Take profit: Set profit targets at the Fibonacci retracement levels of the AD leg or use nearby support/resistance zones for better exit management.
While the indicator provides reliable reversal signals, it’s recommended to combine it with other tools such as RSI, MACD, or moving averages to confirm momentum strength.
Why Use the Butterfly Indicator for MT4
Automatic pattern detection: No need to calculate Fibonacci ratios manually — the indicator does it instantly.
Accurate reversal zones: Identifies potential turning points with high precision.
Clear buy/sell signals: Visual signals make it easy to trade even for beginners.
Works on all timeframes: Suitable for Scalping (M5–M15), day trading (H1–H4), or swing trading (D1).
Free to download and install: Lightweight and compatible with all MT4 brokers.
The indicator’s ability to detect multiple Butterfly formations simultaneously on different pairs or timeframes gives traders a broader perspective of market conditions.
Tips for Best Results
Combine the Butterfly Indicator with price action tools like trendlines and candlestick patterns.
Always confirm signals on higher timeframes to avoid false reversals.
Avoid trading during major economic news releases, as volatility may distort harmonic formations.
Backtest the indicator on historical data to understand its behavior across different pairs.
Conclusion
The Butterfly Indicator for MT4 is an advanced harmonic pattern detection tool that helps traders identify high-probability Trend Reversal zones with accuracy. By automating the complex process of Fibonacci measurement and pattern recognition, it empowers both beginner and professional traders to make smarter trading decisions.
Whether you’re a scalper, day trader, or swing trader, the Butterfly Indicator can enhance your strategy by highlighting areas where market reversals are most likely to occur. Combined with sound risk management and confirmation tools, it becomes one of the most reliable harmonic indicators available for MetaTrader 4.
FAQ
2 Downloads
Published:
Nov 12, 2025 23:45 PM
Category: