Master Market Noise with the ATR Volatility Indicator for MT4
Financial markets are rarely static. They constantly transition between long periods of quiet consolidation and sudden, explosive bursts of liquidity. For retail traders, the biggest risk isn't choosing the wrong trend direction—it is failing to adapt to these shifting environments. Trading with fixed pip targets or tight, rigid stop-losses during a high-velocity market expansion is a guaranteed recipe for premature stop-outs.
The ATR Volatility indicator provides the technical solution to this problem. By measuring the market's true velocity in real time, this foundational software helps you align your risk parameters with current statistical realities.
What is the ATR Volatility Indicator?
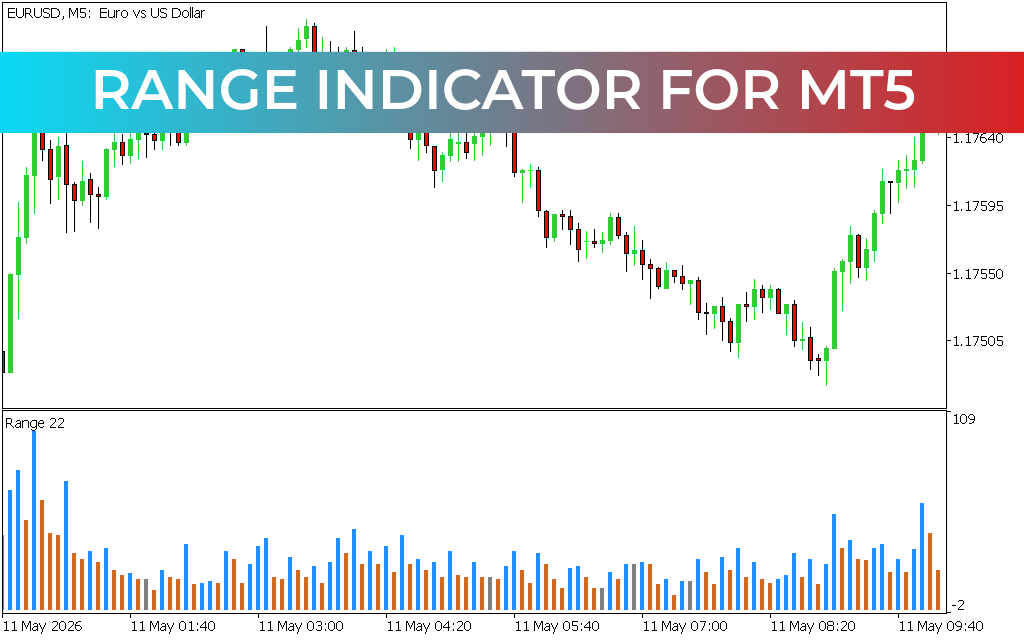
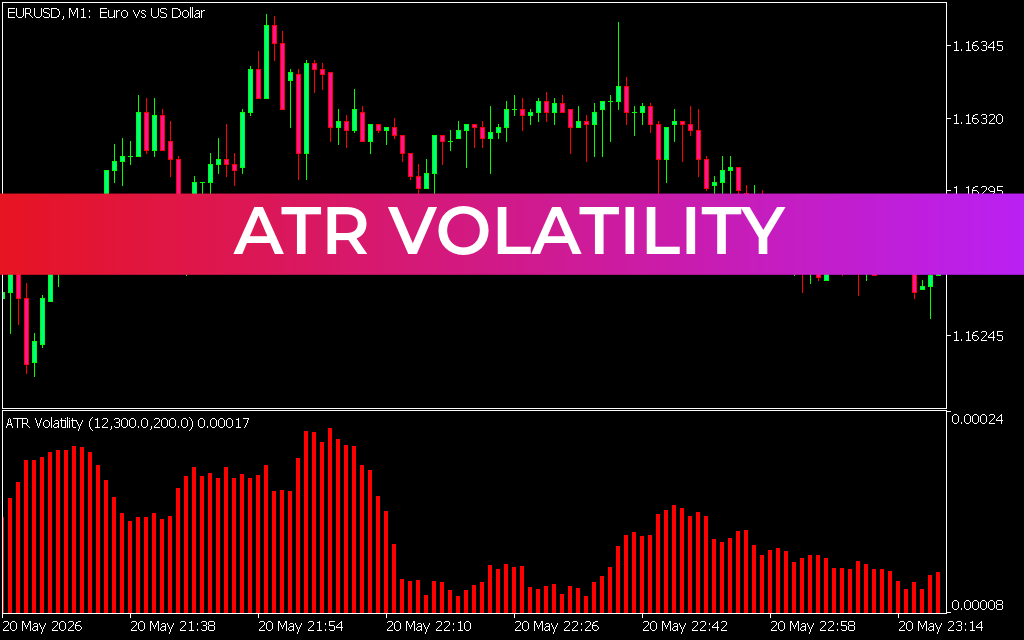
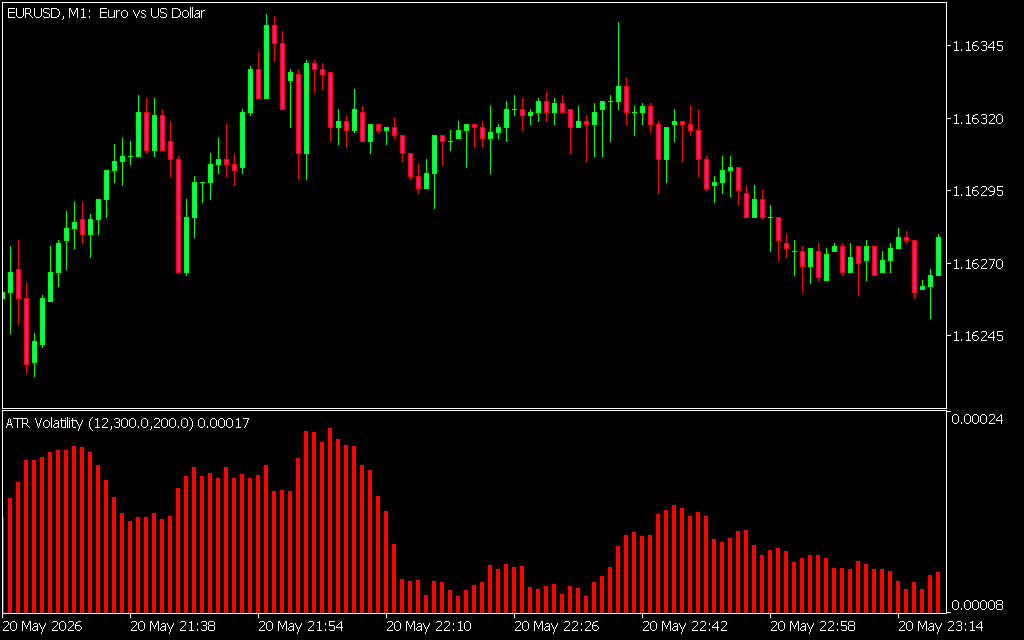
The ATR Volatility Indicator is an advanced technical tool engineered for the MetaTrader platform. It is based on J. Welles Wilder’s legendary Average True Range (ATR) formula, which calculates the true distance between the highs, lows, and closing prices of an asset over a set lookback period.
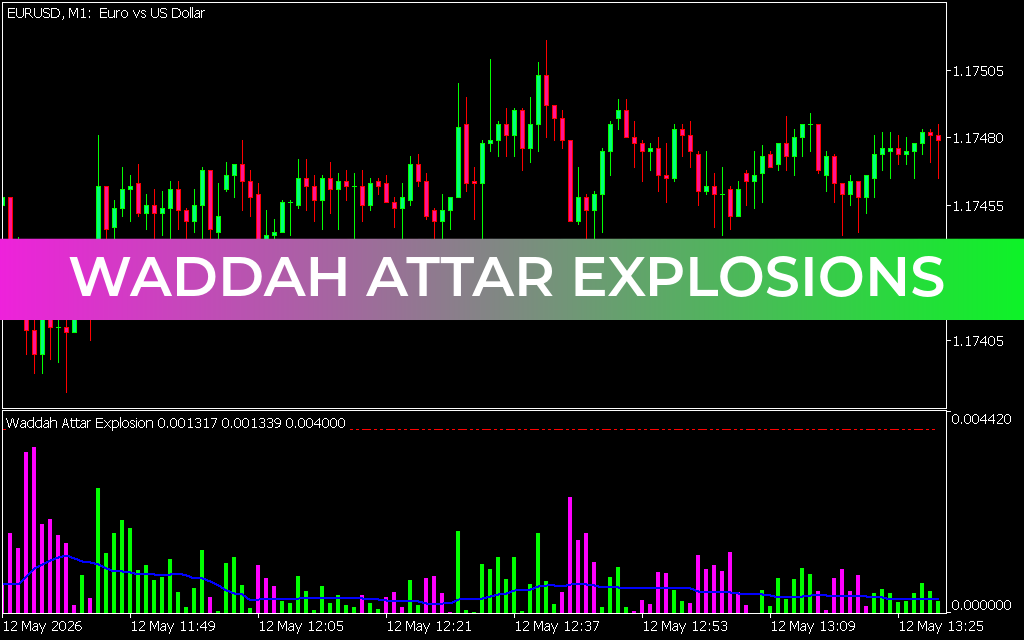
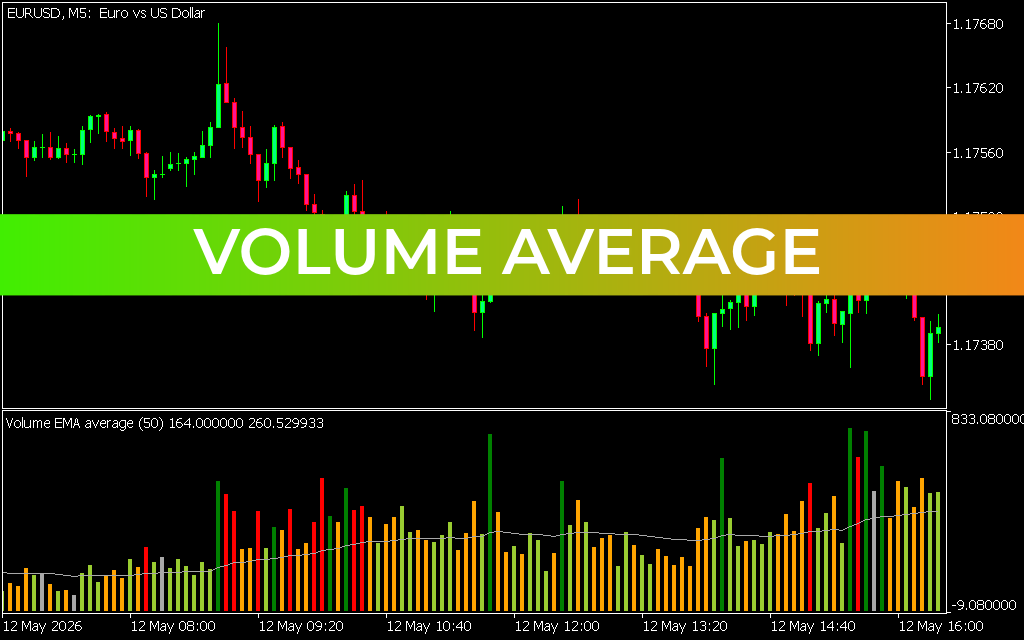
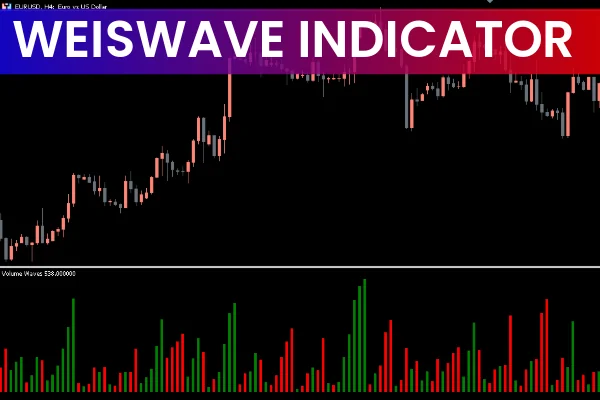
Instead of plastering messy lines over your candlesticks, this indicator displays clear, actionable histogram bars or a smooth mathematical wave in a dedicated panel beneath your main workspace. When the histogram bars rise, it signals a powerful surge in market volume and price expansion. When the bars decay, it confirms the market is slipping into a quiet, low-liquidity range.
Key Features and Strategic Advantages
- Pure Volatility Isolation: Tracks absolute price movement completely independent of direction, showing you how fast a market is moving, not just where it is going.
- Dynamic Stop-Loss Optimization: Eliminates retail guesswork by letting you place your stop-losses outside the market's average breathing room.
- Breakout Validation Filter: Helps you identify genuine, institutional breakouts by ensuring that a key level breach is accompanied by rising volatility metrics.
- Multi-Timeframe Compatibility: Highly optimized across various chart layouts, providing crisp historical tracking whether you are Scalping on the M1 or trend trading the daily frames.
How to Trade with ATR Volatility
Integrating this volatility filter into your daily charting routine immediately refines your systematic trade management:
1. Adaptive Risk Management
When the ATR Volatility indicator shows high values, the market is swinging aggressively. Smart traders use this data to widen their stop-losses to avoid being shaken out by ordinary noise, while simultaneously scaling down their lot sizes to keep their total dollar risk identical.
2. Precision Take-Profit Placement
Don't guess your profit targets. Look at the active ATR reading to determine exactly how many pips an asset is mathematically capable of moving during your typical holding time. Placing your take-profit order inside this boundary radically improves your overall fill consistency.
3. Filtering False Consolidation Traps
When the indicator hits historical lows, the market is wound tight like a spring. Avoid trading mean-reversion strategies during these periods, as a compressed ATR reading is the classic calm before a massive, directional breakout storm.
Conclusion
To survive in modern financial markets, your technical strategy must be as dynamic as the Price Action itself. The ATR Volatility indicator converts raw market fluctuations into clear, math-based boundaries, giving you the clarity needed to protect your equity. Download the indicator today to eliminate retail guesswork and start managing your trades with institutional precision.
8 Downloads
Last Update:
May 21, 2026 16:46 PM
Published:
Jan 17, 2026 19:56 PM
Category: