Master Price Retracements with the Auto Fibonacci Trading Zone Indicator
The Fibonacci retracement is perhaps the most revered tool in a technical analyst’s arsenal, rooted in the mathematical patterns that govern natural growth and market psychology. However, drawing these levels manually can be subjective and time-consuming, especially when markets are moving fast. The Auto Fibonacci Trading Zone indicator for MT4 and MT5 automates this process, providing traders with an objective, real-time map of potential reversal and continuation zones.
The Power of Automated Fibonacci Analysis
In trading, "Golden Ratios" like 61.8% and 38.2% often act as self-fulfilling prophecies. When a strong trend occurs, price rarely moves in a straight line; it breathes. The Auto Fibonacci Trading Zone identifies the most recent significant high and low, automatically projecting the key Fibonacci levels ($23.6\%$, $38.2\%$, $50.0\%$, $61.8\%$, and $76.4\%$) onto your chart.
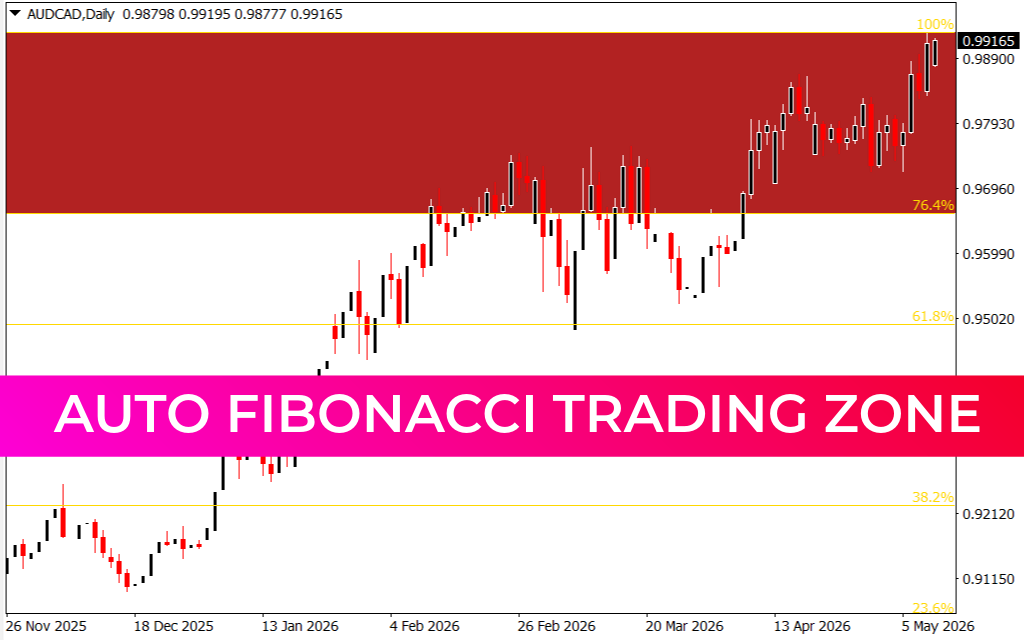
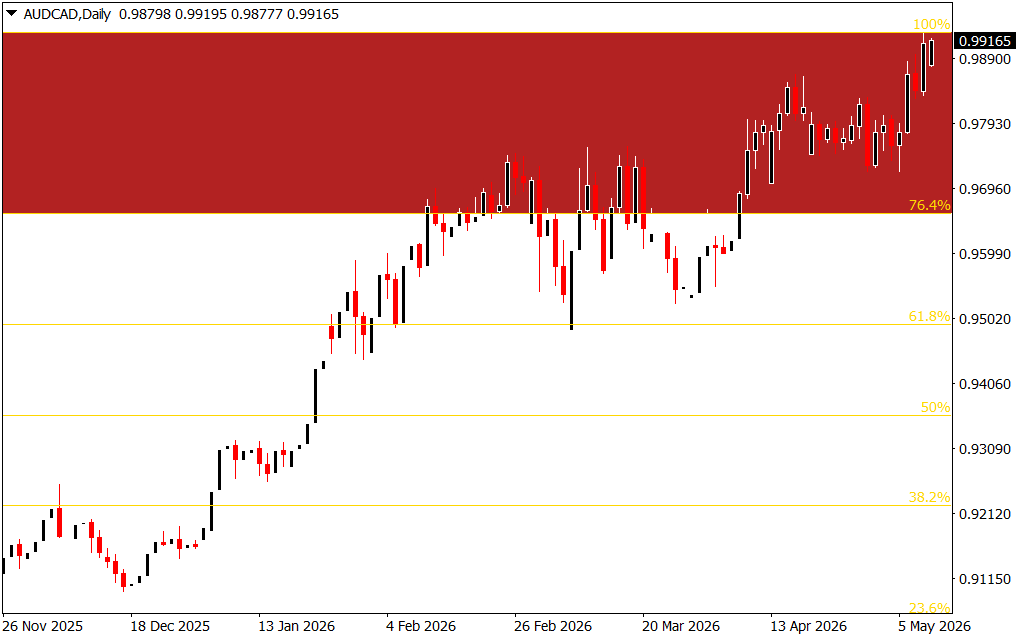
As seen in the AUD/CAD Daily chart, the indicator doesn't just draw thin lines; it highlights the "Golden Zone"—typically the area between the 76.4% and 100% levels—in a bold red fill. This visual emphasis alerts traders to high-probability reversal areas or "exhaustion zones" where the prevailing trend may stall or face significant resistance.
Key Features and Strategic Advantages
- Real-Time Dynamic Adjustments: Unlike manual tools that stay fixed where you draw them, this indicator shifts automatically as price carves out new swing highs or lows. This ensures your levels are always relevant to the current Market Structure.
- Visual Trading Zones: By shading the upper-tier retracement levels, the indicator simplifies the decision-making process. For sellers, a rally into the red zone represents a premium "sell" opportunity. For buyers, it marks a target area to scale out of long positions.
- Multi-Timeframe Accuracy: Whether you are Scalping the 15-minute chart or swing trading the Daily, the Auto Fibonacci Trading Zone maintains mathematical consistency, allowing you to see where short-term pullbacks align with long-term structural levels.
- Precision Price Labels: The indicator includes clear price tags (e.g., 0.95020 for the 61.8% level) on the right axis, making it effortless to set precise limit orders and stop-losses.
How to Trade the Zones
The most effective way to use the Auto Fibonacci Trading Zone is to look for confluence. When a Fibonacci level aligns with a previous support/resistance area or a moving average, the probability of a successful trade increases exponentially.
In a bullish trend, a pullback to the 50% or 61.8% level is often viewed as a "discount" entry. Conversely, as shown in the AUD/CAD example, when price pushes into the 100% extension zone, it signals that the market is entering a state of potential overextension, prompting cautious traders to tighten their stops or look for reversal patterns.
Eliminate the guesswork of manual charting. The Auto Fibonacci Trading Zone provides the structural clarity needed to trade retracements with professional-grade precision.
3 Downloads
Last Update:
May 11, 2026 21:18 PM
Published:
Jan 24, 2026 13:40 PM
Category: