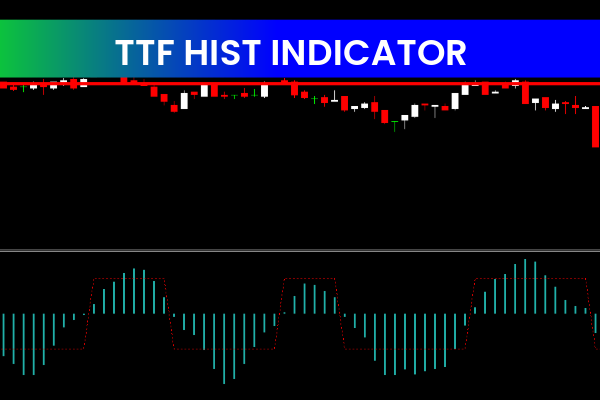
The TTF Hist Forex Indicator is a widely used and free tool for MetaTrader 4 (MT4) traders who want a clear view of market movements. This indicator provides an easy-to-understand visual representation of past and present Price Action through color-coded histograms. By displaying both historical and current market singnal data, the TTF Hist indicator helps traders identify potential entry and exit points, forecast price movements, and make better-informed trading decisions.

Understanding market trends and price behavior is key for successful trading. Many traders struggle to differentiate between recent and historical price movements, which can lead to missed opportunities or poorly timed trades. The TTF Hist Forex Indicator solves this problem by separating past and current price action into two distinct histograms, making analysis straightforward and actionable.
What Is the TTF Hist Indicator?
The TTF Hist Indicator is an MT4 tool designed to visualize market data in a histogram format. It plots two separate histograms:
Past Price Histogram: Displays historical price movements on the left side of the indicator.
Current Price Histogram: Shows real-time price movements on the right side of the indicator.
The histograms are color-coded to indicate price direction:
Red Bars: Represent upward price movement (bullish momentum).
Blue Bars: Represent downward price movement (bearish momentum).
By analyzing these histograms, traders can quickly assess market trends, potential reversals, and the strength of ongoing price movements.
How the TTF Hist Indicator Works
The indicator works by processing price data and separating it into past and current market segments. This allows traders to visually compare recent price behavior with historical trends.
Key features include:
Color-coded histograms for easy direction recognition
Vertical display separating past and current price data
Real-time updates for current price movement
Compatibility with all MT4 timeframes
By combining historical context with current market information, the TTF Hist Indicator enables traders to anticipate potential market shifts and plan trades more effectively.
Benefits of Using the TTF Hist Indicator
Improved Trade Timing
Traders can identify optimal entry and exit points by observing how current price movements compare to historical trends.
Clear Visual Representation
The red and blue histograms make it easy to distinguish bullish and bearish price action at a glance.
Easy to Use
No complicated settings are required. Once added to an MT4 chart, the indicator is ready to display market data in an intuitive format.
Market Trend Insights
By tracking both past and current price action, traders gain insight into market momentum and potential reversals, improving decision-making accuracy.
How to Use the TTF Hist Indicator on MT4
To install and use the TTF Hist Indicator:
Download the indicator file
Copy it into the MT4 “Indicators” folder
Restart MetaTrader 4
Attach the indicator to any chart
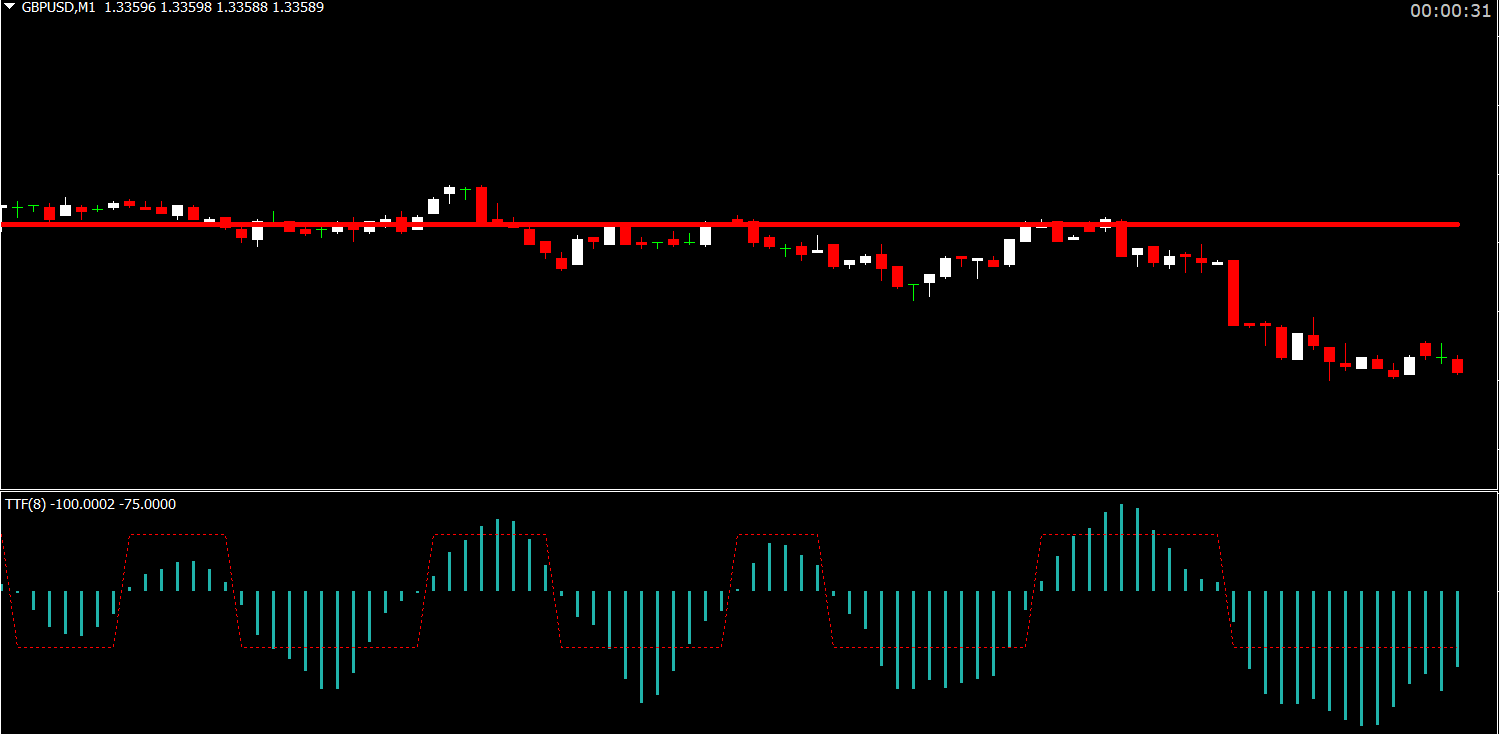
The indicator will display two vertical histograms on the chart, allowing traders to immediately assess market direction and strength.
Who Should Use This Indicator?
The TTF Hist Forex Indicator is ideal for:
Day traders seeking short-term price movement insights
Swing traders analyzing market momentum
Forex beginners learning how past and present prices interact
Experienced traders enhancing trade timing accuracy
Its versatility makes it suitable for all types of trading strategies.
Final Thoughts
The TTF Hist Forex Indicator is a simple yet powerful MT4 tool that helps traders visualize past and current market data through color-coded histograms. By using this indicator, traders can improve trade timing, anticipate potential price movements, and make more informed decisions.
Visit IndicatorForest.com to download the TTF Hist Indicator and explore other MT4 tools designed to enhance your trading strategy.
FAQ
The TTF Hist Indicator provides an easy-to-understand visual representation of past and present price action through color-coded histograms. It separates past and current price action into two distinct histograms: the left side displays historical price movements while the right side shows real-time price movements, making analysis straightforward and actionable.
Red bars represent upward price movement (bullish momentum), while blue bars represent downward price movement (bearish momentum). By analyzing these histograms, traders can quickly assess market trends, potential reversals, and the strength of ongoing price movements by comparing current action to historical patterns.
Traders can identify optimal entry and exit points by observing how current price movements compare to historical trends. The visual comparison between past and present price action helps anticipate potential market shifts and plan trades more effectively, improving decision-making accuracy.
Yes, the TTF Hist Forex Indicator is ideal for day traders seeking short-term price movement insights, swing traders analyzing market momentum, Forex beginners learning how past and present prices interact, and experienced traders enhancing trade timing accuracy. Its versatility makes it suitable for all types of trading strategies.
No complicated settings are required. Once added to an MT4 chart, the indicator is ready to display market data in an intuitive format. The clear visual representation makes it easy to distinguish bullish and bearish price action at a glance, requiring minimal technical knowledge to interpret.
Published:
Dec 16, 2025 01:30 AM
Category: