Precision Trading with the Step RSI Indicator
In the world of technical analysis, the Relative Strength Index (RSI) is a staple. However, standard RSI can often be "noisy," producing jagged movements that lead to premature entries or false exit signals. The Step RSI indicator is a modern evolution designed to solve this problem by applying a step-price filtering algorithm to the oscillator’s calculation.
What is the Step RSI?
Step RSI is a momentum-based indicator that transforms the classic RSI into a "staircase" format. It uses a smoothing process that only updates the indicator value when a significant price movement occurs. This "step" logic effectively ignores the market noise and minor retracements that usually cause standard oscillators to fluctuate wildly. By focusing on meaningful momentum, it allows traders to stay in trends longer and avoid being "chopped" in sideways markets.
Key Benefits for Traders
- Reduced Market Noise: By filtering out insignificant Price Action, the Step RSI provides a much smoother line, making it easier to identify the actual direction of momentum.
- Clearer Overbought/Oversold Signals: While traditional RSI may linger in extreme zones, the Step RSI’s structured movement makes it easier to spot genuine reversals when the "steps" begin to turn back toward the median.
- Divergence Clarity: Trading RSI divergence is a popular strategy. The stepped nature of this indicator makes bullish and bearish divergences stand out more clearly against the price action.
- Trend Following: When the Step RSI maintains a flat "plateau" or continues stepping in one direction, it confirms strong trend persistence, giving traders the confidence to hold their positions.
Strategic Implementation
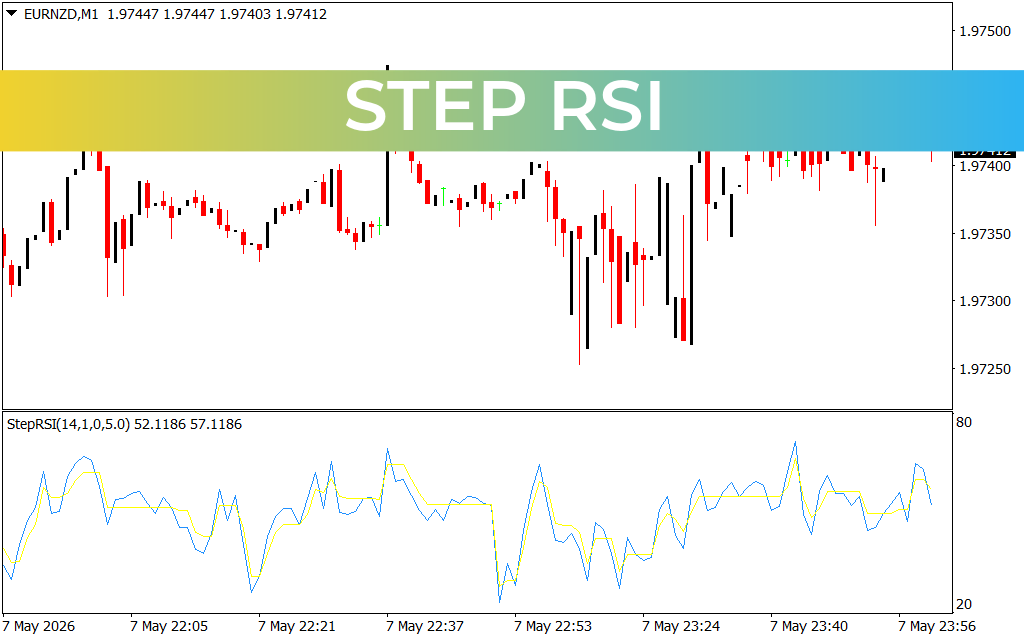
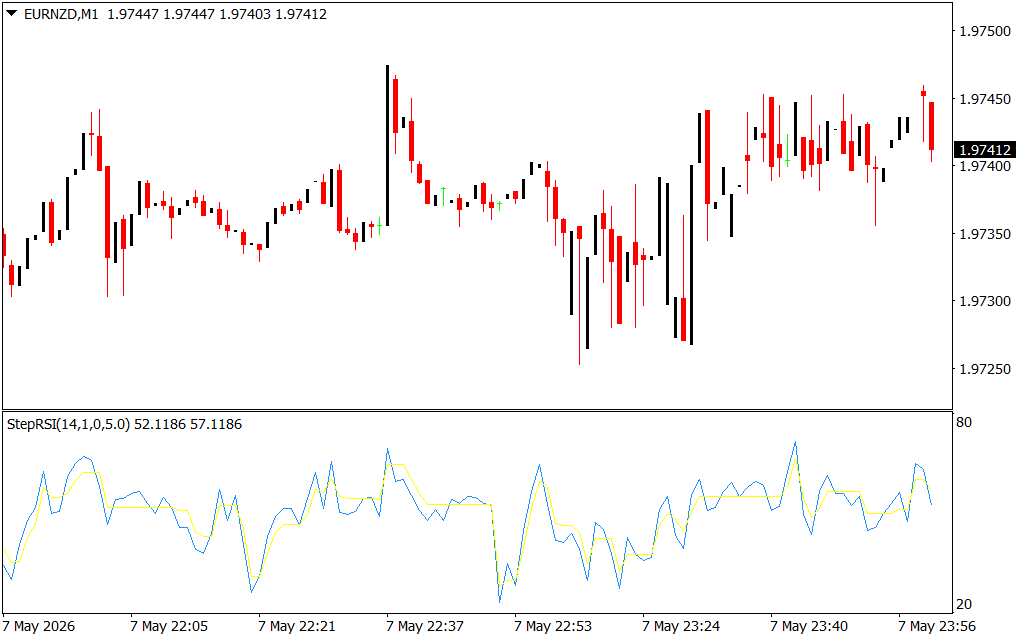
The Step RSI is particularly powerful when used on lower timeframes like M1 and M5 for Scalping, as seen in the accompanying chart. Traders often look for the crossover of the Step RSI line against its signal line or a specific level (like the 50-level) to confirm a change in trend.
For optimal results, combine the Step RSI with price action analysis or trend-following tools. When the indicator creates a "step" up from the oversold region (20-30 level), it signals a potential long entry. Conversely, a step down from the overbought region (70-80 level) suggests that selling pressure is entering the market.
1 Download
Last Update:
May 08, 2026 03:01 AM
Published:
Jan 25, 2026 22:25 PM
Category: