Mastering Market Cycles with the RBCI v2 Line Indicator
In the pursuit of consistent trading results, the greatest challenge is often separating genuine price trends from temporary market "noise." Conventional oscillators frequently generate false signals during high volatility. The RBCI v2 Line Indicator (Range Bound Composite Index) offers a sophisticated solution by applying digital filtration techniques to Price Action, allowing MetaTrader 4 (MT4) traders to visualize the underlying cyclical energy of any financial instrument.
What is the RBCI v2 Line Indicator?
The RBCI is rooted in digital signal processing. Unlike standard momentum indicators that simply measure speed, the RBCI is a "band-pass" filter. It is designed to eliminate both low-frequency trends (the long-term "drift" of the market) and high-frequency noise (random price ticks). What remains is the composite index—a clear, wave-like line that oscillates around a zero-median.
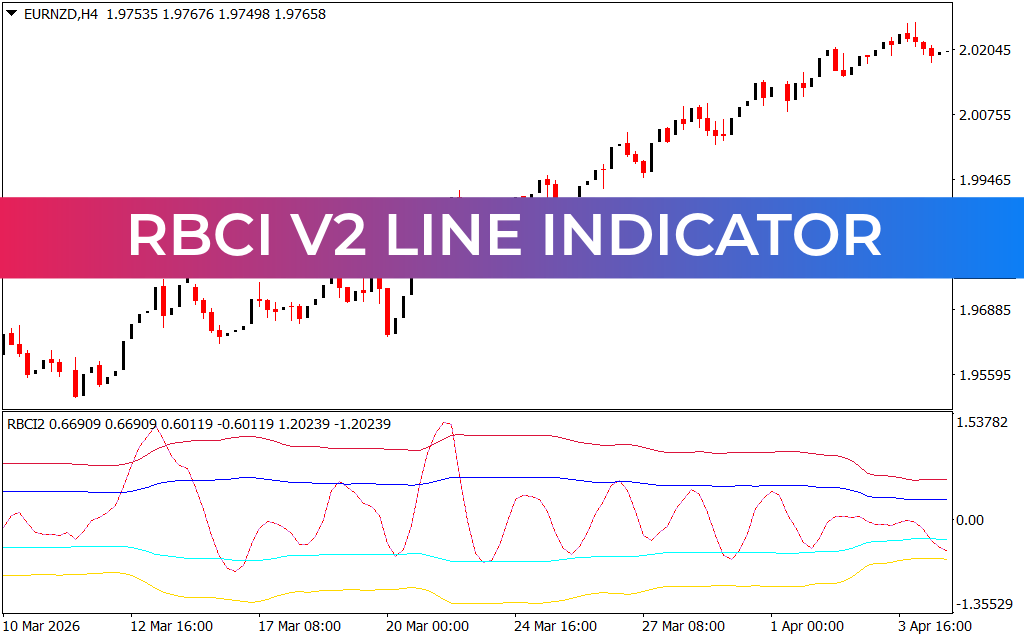
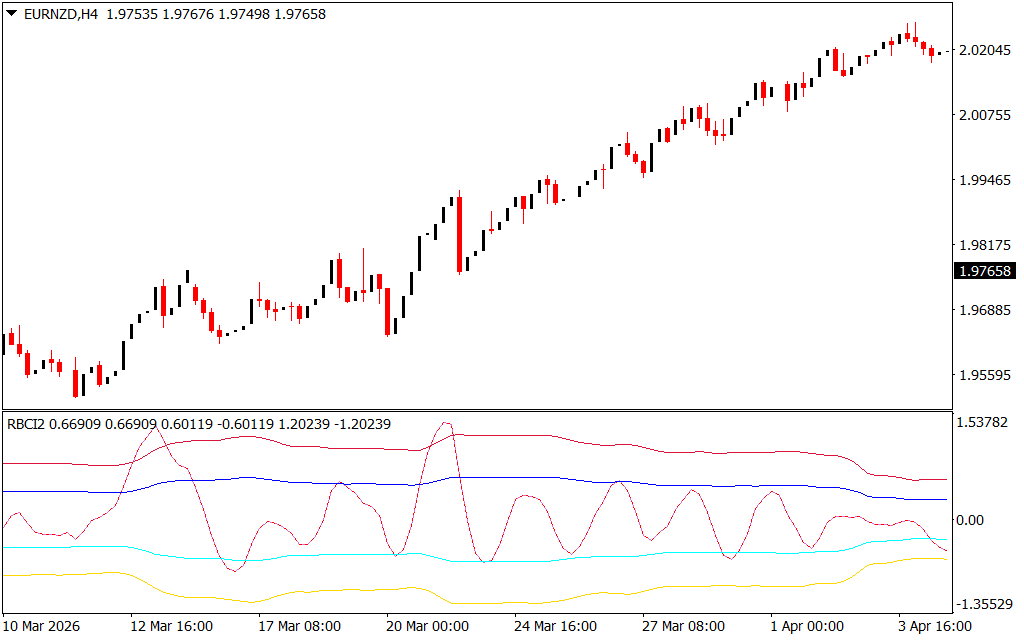
As seen in the H4 chart, the indicator also features volatility envelopes. These outer bands expand and contract based on the market's standard deviation, providing a dynamic context for the RBCI line's movement.
Strategic Advantages for Professional Traders
- Noise-Free Analysis: By stripping away random fluctuations, the RBCI v2 allows you to see the "true" rhythm of the market. This is essential for identifying the start and end of specific price cycles.
- Early Reversal Detection: The RBCI line often reaches its peaks or troughs before the actual price action does. This leading characteristic gives traders a "heads up" on potential trend exhaustion.
- Overbought and Oversold Precision: When the RBCI line touches or pierces the outer volatility envelopes, the market is statistically overextended. These zones offer high-probability opportunities for mean-reversion trades.
- Zero-Line Confluence: The zero-line acts as a pivot point for sentiment. When the RBCI line crosses above zero, bullish momentum is building; a cross below zero indicates that bearish pressure is taking over.
How to Trade with RBCI v2
The most effective way to utilize this indicator is by watching the relationship between the RBCI line and the outer bands. In a trending market, like the EURNZD move shown on the chart, the line will stay pinned to one side of the zero-median.
Traders typically look for "cycle exhaustion" signals: if the price is making a new high but the RBCI line fails to reach its previous peak (divergence), a major correction is likely imminent. Additionally, the crossover of the RBCI line through its signal or zero-line provides a definitive mechanical trigger for entering or exiting positions.
Whether you are a swing trader looking for the "meat" of a move or a scalper timing precise entries, the RBCI v2 Line Indicator provides the mathematical clarity needed to trade with institutional-grade precision.
3 Downloads
Last Update:
May 08, 2026 20:06 PM
Published:
Jan 25, 2026 21:22 PM
Category: