Master Market Timing with the DPO Indicator for MT4
In the quest for professional-grade market analysis, the biggest obstacle traders face is the overwhelming "noise" of long-term price trends. While standard oscillators like the RSI or MACD are useful, they often fail to isolate the short-term cyclical swings that offer the highest precision for entries. The Detrended Price Oscillator (DPO) for MetaTrader 4 (MT4) is a specialized technical tool designed to solve this exact problem. By mathematically removing long-term trends from Price Action, the DPO allows you to focus exclusively on short-term cycles and overbought/oversold conditions.
The Science of Detrending Price Action
The DPO is unique because, unlike most oscillators, it is not a Momentum Indicator. Instead, it measures the distance between a past price and a displaced moving average. This displacement "detrends" the data, effectively stripping away the broader market direction to reveal the underlying rhythmic cycles of the market.
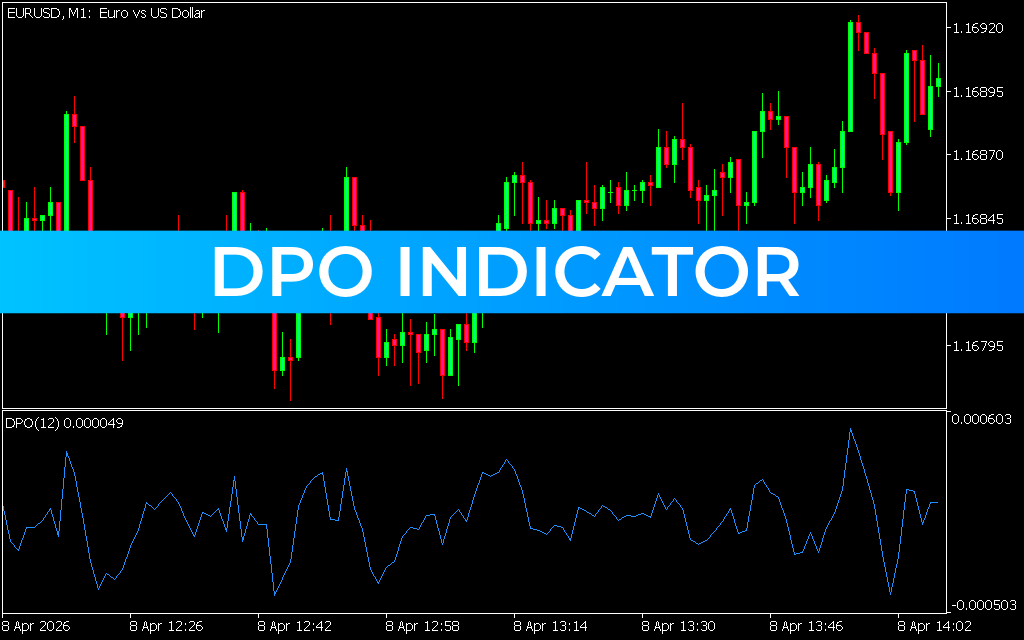
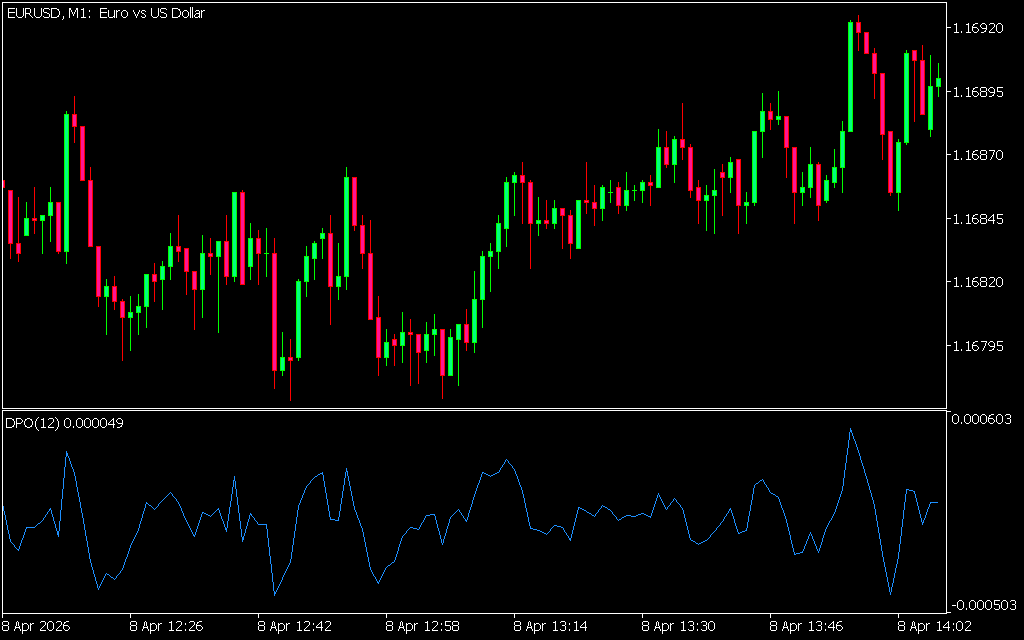
As observed in technical analysis on high-liquidity pairs like EUR/USD on the M1 timeframe, the DPO provides a definitive operational advantage:
- Precision Cycle Identification: The DPO excels at highlighting the peaks and troughs of market cycles. As seen on recent M1 charts, the indicator oscillates around a zero line. When the DPO line peaks, it indicates a cyclical high is likely in place, providing a mechanical signal to look for short opportunities or exit longs.
- True Overbought and Oversold Levels: Because it is detrended, the DPO offers a much "cleaner" view of market extremes than traditional oscillators. When price strays too far from the displaced average, the DPO reaches an extreme level, signaling a high-probability mean-reversion trade toward the zero line.
- Accurate Divergence Detection: The DPO is world-class at spotting hidden divergences. If price action makes a higher high but the DPO makes a lower peak, it warns that the underlying short-term cycle is exhausting, even if the long-term trend appears strong.
- Leading Signal Capability: Because the DPO is based on a displaced moving average, it effectively looks "back" to project "forward." This allows systematic traders to anticipate cycle turns before they are fully reflected in lagging trend-following indicators.
Strategic Implementation for Professional Traders
The DPO Indicator is an essential asset for any trader who values structural clarity and mathematical timing.
- Zero-Line Crossovers: A move from below to above the zero line signals a shift into a bullish cycle phase. Conversely, a drop below zero indicates that the short-term cycle has turned bearish.
- Harmonic Convergence: Use the DPO in conjunction with volatility tools like the Bollinger Bandwidth Ratio. When the DPO reaches a cyclical extreme just as volatility begins to contract, a massive mean-reversion move is often imminent.
- Scalping Precision: On lower timeframes like the M1 or M5, the DPO’s responsiveness makes it a premier tool for quick "burst" trades, helping scalpers capture rapid cyclical displacements.
Conclusion
The DPO Indicator for MT4 is a definitive solution for traders who demand more than just standard lagging data. By bridging the gap between historical cycles and real-time execution, it empowers you to navigate the financial markets with professional-grade clarity. Elevate your technical analysis today and master the rhythm of the markets with the DPO system.
SEO Meta Description
2 Downloads
Last Update:
Apr 18, 2026 00:22 AM
Published:
Feb 07, 2026 20:09 PM
Category: