Master Market Turning Points with the Support Resistance Breakthrough Indicator for MT4
In the fast-paced world of forex trading, identifying structural turning points before they happen is the key to a sustainable trading edge. Relying on lagging indicators or subjective hand-drawn lines often results in entering trades too late or falling victim to false breakouts. The Support Resistance Breakthrough Indicator for MetaTrader 4 (MT4) offers a solution by mathematically plotting critical Supply And Demand ceilings right onto your live price candlesticks.
Equipped with automated trend confirmation alerts, this charting tool takes the guesswork out of structural analysis, allowing retail day traders to execute high-probability reversals and breakout strategies cleanly.
What is the Support Resistance Breakthrough Indicator?
The Support Resistance Breakthrough indicator is an automated, on-chart Price Action engine designed to map institutional supply and demand blocks. Instead of occupying valuable space in a sub-window, it runs complex calculations directly on your primary chart view to track localized market structures.
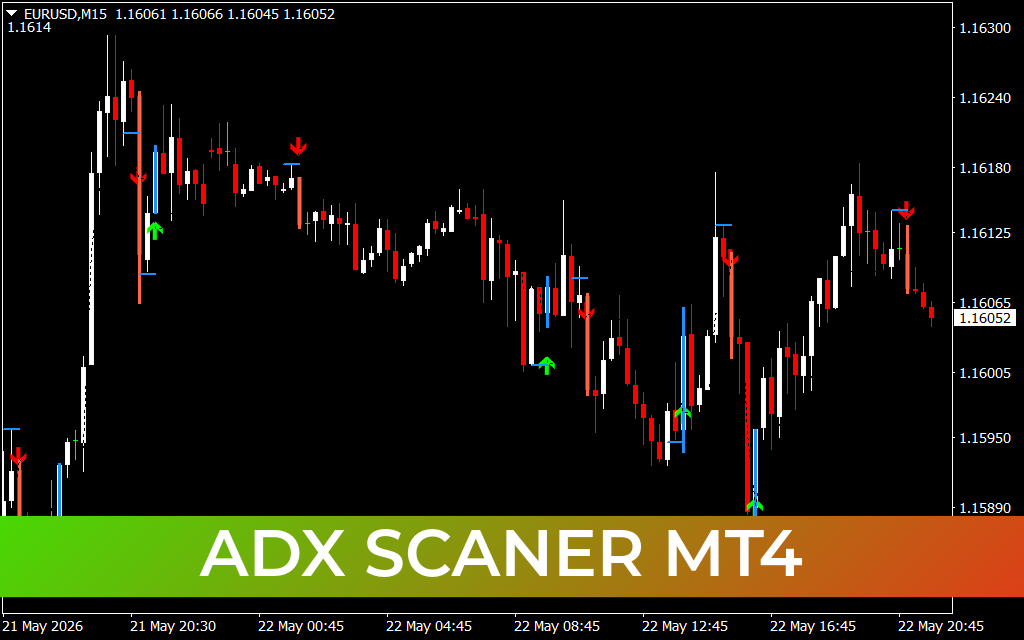
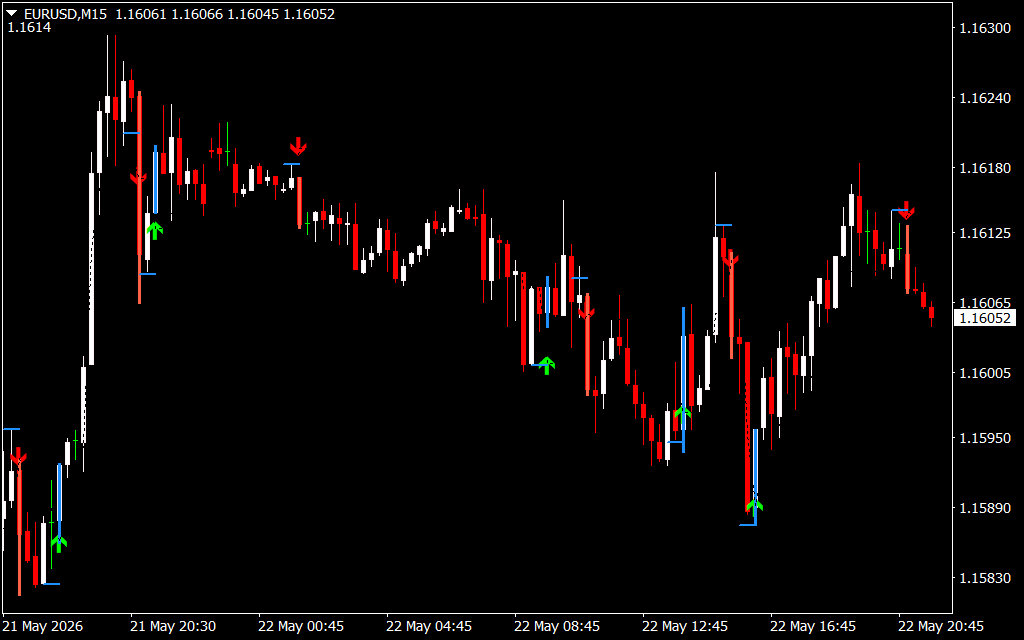
As demonstrated on the EURUSD M15 chart, the indicator plots solid technical anchor levels paired with clear visual execution signals:
- Blue Horizontal Anchors: Define immediate structural support zones where buyers historically defend the price.
- Light Blue Horizontal Anchors: Highlight short-term overhead resistance zones where temporary selling pressure builds.
- Green Up-Arrows: Signal a successful bullish rejection of a support floor or an upward breakout verification.
- Red Down-Arrows: Signal a validated bearish rejection of an overhead ceiling or a downward breakthrough confirmation.
Key Features and Benefits
- Automated Level Generation: Instantly drafts critical horizontal Support And Resistance steps, saving you time during pre-session markups.
- On-Chart Entry Alerts: Features explicit arrow signals (green for buy, red for sell) at high-confluence breakdown and bounce points to maximize execution accuracy.
- Dynamic Range Identification: Highlights local consolidation blocks clearly, helping you differentiate between choppy ranges and high-velocity trend expansions.
- Multifunctional Day Trading Utility: Optimized for lower timeframes like the M15 chart, making it an excellent filter for scalpers and intraday trend-followers alike.
How to Trade with the Support Resistance Breakthrough Indicator
Integrating this technical toolkit into an active trading routine introduces clear, objective parameters for handling daily price movements:
- The Support Rejection (Buy Trigger): When a currency pair dips into a blue support boundary, wait for the indicator to validate the floor. The moment a green up-arrow prints at the structural low, it confirms institutional absorption. Enter long at the close of the candle.
- The Resistance Rejection (Sell Trigger): When price rallies into an overhead light blue ceiling, monitor the price action closely. The printing of a red down-arrow signals that buying momentum has dried up and sellers are re-entering, offering a low-drawdown short entry opportunity.
- Breakthrough Continuum: If price breaks forcefully through a plotted horizontal segment and a confirmation arrow triggers in the direction of the break, it marks a valid momentum breakthrough. Use this to trade the extension toward the next historical target line.
Conclusion
The Support Resistance Breakthrough MT4 indicator is a vital charting tool for any price action or structure-focused trader. By translating messy market static into clean horizontal zones and clear arrow triggers, it simplifies your execution and ensures you trade alongside institutional money flows.
1 Download
Last Update:
May 23, 2026 22:20 PM
Published:
Jan 15, 2026 21:01 PM
Category: