Precision Trend Analysis with the Dss MA Difference Indicator
In the world of professional technical analysis, moving averages are often criticized for being "lagging" indicators—reacting to market moves only after they have already occurred. The Dss MA Difference indicator is a sophisticated evolution of traditional trend-following tools, designed to minimize lag and maximize clarity. By calculating the specific variance between different moving average calculations and applying a Double Smoothed Stochastic (DSS) algorithm, it provides a highly responsive visual map of market momentum.
The Science of Double Smoothing
Standard moving averages often struggle during periods of market consolidation, producing "whipsaws" or false signals. The Dss MA Difference addresses this by applying a secondary smoothing layer. This process filters out minor price fluctuations (market noise) while highlighting the actual velocity of the current trend.
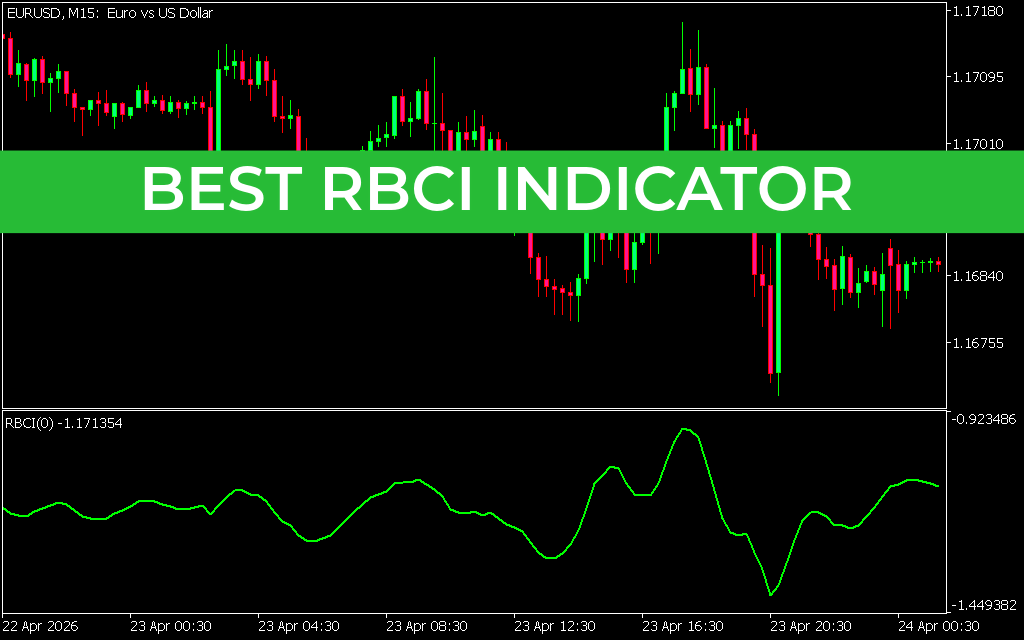
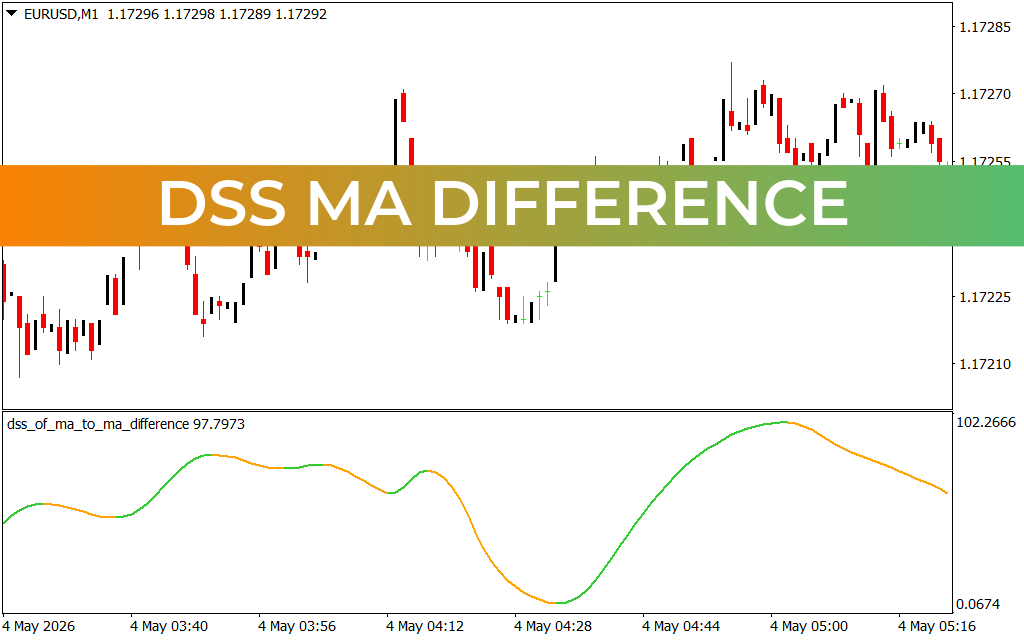
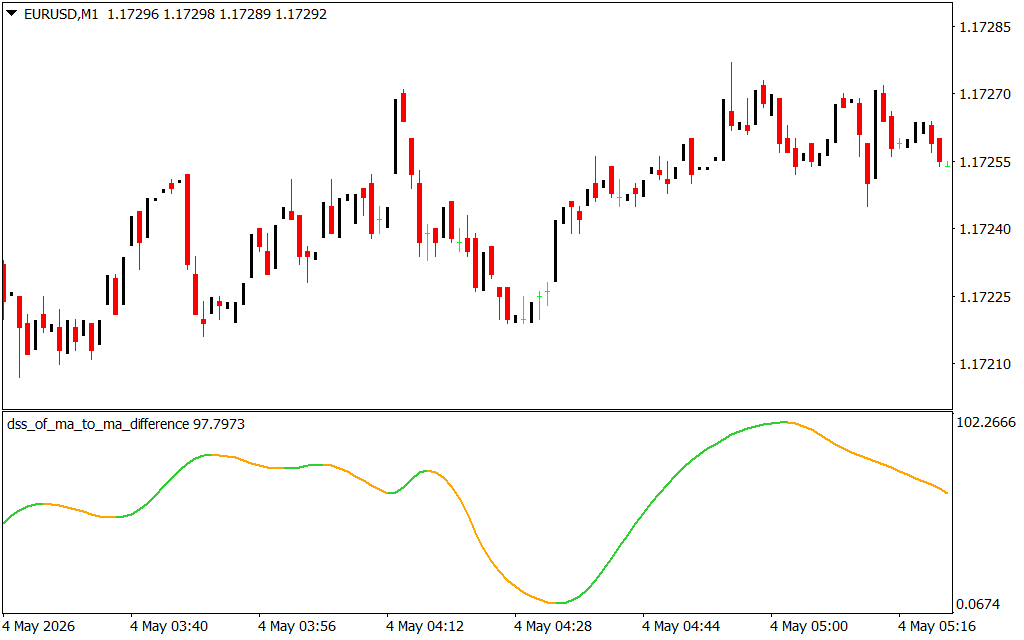
The indicator is displayed as a clean oscillator in a separate sub-window, featuring a color-coded line that shifts dynamically with the market's conviction:
- Green Line (Bullish Momentum): When the indicator line turns green and begins to rise, it signals that the short-term moving average is pulling away from the longer-term baseline with upward force. This is a primary signal for long entries.
- Orange Line (Bearish Momentum): A shift to orange indicates that the momentum has peaked and is now rolling over. This visual cue warns traders that selling pressure is increasing and that the recent uptrend may be exhausting.
Strategic Advantages on the M1 Chart
As demonstrated in the EURUSD M1 chart, the Dss MA Difference excels in high-frequency trading environments. On a 1-minute timeframe, the speed of execution is critical. Notice how the indicator provides a smooth, rhythmic wave that mirrors the underlying Price Action without the erratic "jaggedness" of a standard RSI or Stochastic.
By tracking the peaks and troughs of the Dss MA Difference line, scalpers can identify overextended conditions. When the line reaches extreme levels and begins to change color, it often precedes a price reversal by several bars, giving traders the necessary lead time to exit positions or prepare for a counter-trend move. It essentially acts as a "speedometer" for price, showing when the market is accelerating and when it is slamming on the brakes.
Integrating Dss MA Difference into Your Workflow
While powerful on its own, this indicator serves as an excellent foundation for a multi-layered trading system:
- Crossover Confirmation: Use the zero-line or color shifts to confirm breakouts from horizontal Support And Resistance levels.
- Trend Strength Filtering: If the line is flat or frequently changing color, it indicates a ranging market where trend-following strategies should be avoided.
- Divergence Detection: Look for instances where price makes a higher high, but the Dss MA Difference makes a lower peak. This divergence is one of the most reliable signals of a pending Trend Reversal.
By providing a clear, smoothed representation of the difference between moving averages, this indicator removes the emotional guesswork from technical analysis and provides a mathematical edge in identifying the market's true direction.
3 Downloads
Last Update:
May 04, 2026 10:26 AM
Published:
Jan 28, 2026 17:26 PM
Category: