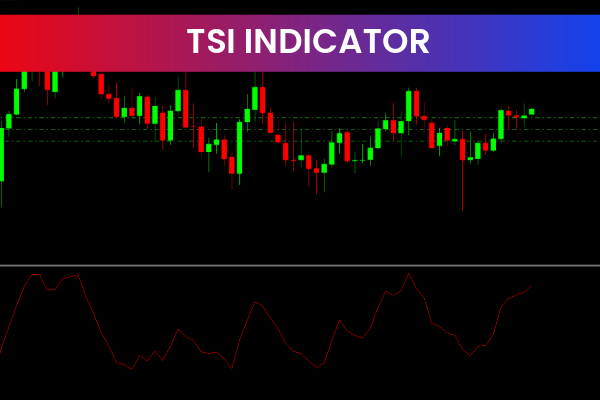
The TSI Indicator (True Strength Index) is a popular and free Forex Indicator designed for the MetaTrader 4 (MT4) trading platform. It is widely used by traders to analyze market momentum, trend direction, and potential trading opportunities.
By combining price movement with smoothing techniques, the TSI Indicator helps traders filter out market noise and focus on meaningful trend signals. This makes it suitable for both beginner and advanced Forex traders looking to improve trade timing and accuracy.
How the TSI Indicator Works
The TSI Indicator measures momentum by analyzing price changes over time using double-smoothed moving averages. Unlike basic oscillators, TSI focuses on the strength behind price movement rather than just direction.
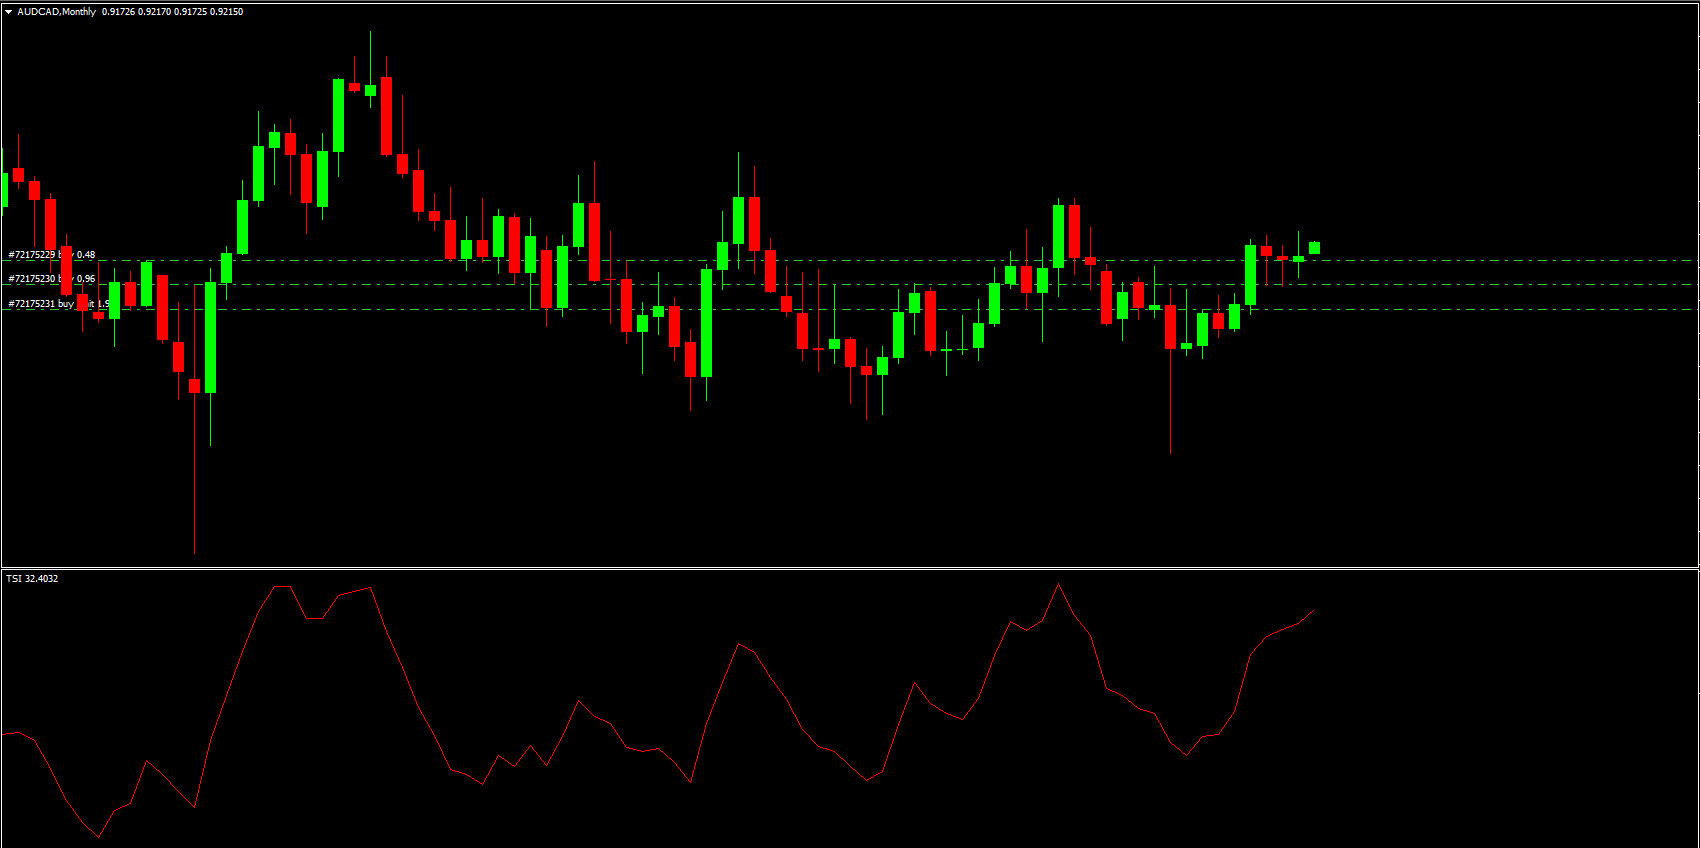
The indicator typically oscillates around a zero line:
Values above zero indicate bullish momentum
Values below zero indicate bearish momentum
Traders can use these momentum shifts to identify emerging trends, trend continuations, and potential reversals.
Key Features of the TSI Indicator
Some of the main features of the TSI Indicator include:
Measures true market momentum
Identifies trend direction and strength
Highlights overbought and oversold conditions
Works on all timeframes
Suitable for all currency pairs
Easy-to-read oscillator format
Free to use on MT4
These features make the TSI Indicator highly versatile for Scalping, day trading, and swing trading strategies.
Benefits of Using the TSI Indicator
The TSI Indicator offers several advantages to Forex traders:
Helps confirm trend direction
Filters out false signals and market noise
Improves entry and exit timing
Identifies momentum shifts before price reversals
Enhances confidence in trading decisions
Because it focuses on momentum rather than raw price, the TSI Indicator provides a deeper understanding of market behavior.
Trading Signals Provided by the TSI Indicator
Traders commonly use the TSI Indicator in the following ways:
Zero Line Crossovers
Crossing above zero → bullish signal
Crossing below zero → bearish signal
Signal Line Crossovers
TSI crossing above its signal line → buy signal
TSI crossing below its signal line → sell signal
Overbought and Oversold Conditions
Extreme high values suggest overbought conditions
Extreme low values suggest oversold conditions
Divergence Trading
Bullish divergence: price makes lower lows, TSI makes higher lows
Bearish divergence: price makes higher highs, TSI makes lower highs
Divergences are especially powerful for spotting potential trend reversals.
How Traders Use the TSI Indicator Effectively
For better results, traders often:
Combine TSI with trend indicators like Moving Averages
Use higher timeframes to confirm trend direction
Apply Price Action or candlestick confirmation
Avoid trading against strong momentum
Use proper stop-loss and risk management
The TSI Indicator works best when used as part of a complete trading strategy rather than on its own.
Who Should Use the TSI Indicator?
The TSI Indicator is suitable for:
Beginner traders learning momentum analysis
Intermediate traders refining entries and exits
Advanced traders confirming Trend Strength
Scalpers, day traders, and swing traders
Its simplicity and effectiveness make it a reliable tool for traders at all experience levels.
Conclusion
The TSI Indicator for MT4 is a powerful, reliable, and free Forex trading tool that helps traders identify momentum, trend direction, and potential market reversals. By analyzing price strength rather than just price movement, it provides clearer and more meaningful trading signals.
When combined with proper risk management and other technical tools, the TSI Indicator can significantly enhance trading accuracy and overall performance in the Forex market.
1 Download
Published:
Jan 05, 2026 19:17 PM
Category: