Cutting Through the Noise: Trading Cycles with a Band Pass Filter
In the high-frequency environment of the 1-minute (M1) chart, retail traders face a constant battle against market noise. Intraday Price Action is heavily diluted by brief spikes, erratic liquidity shifts, and non-directional consolidation phases. If you rely purely on conventional lagging indicators, these minor fluctuations create false entry triggers that lead to overtrading and account drawdown.
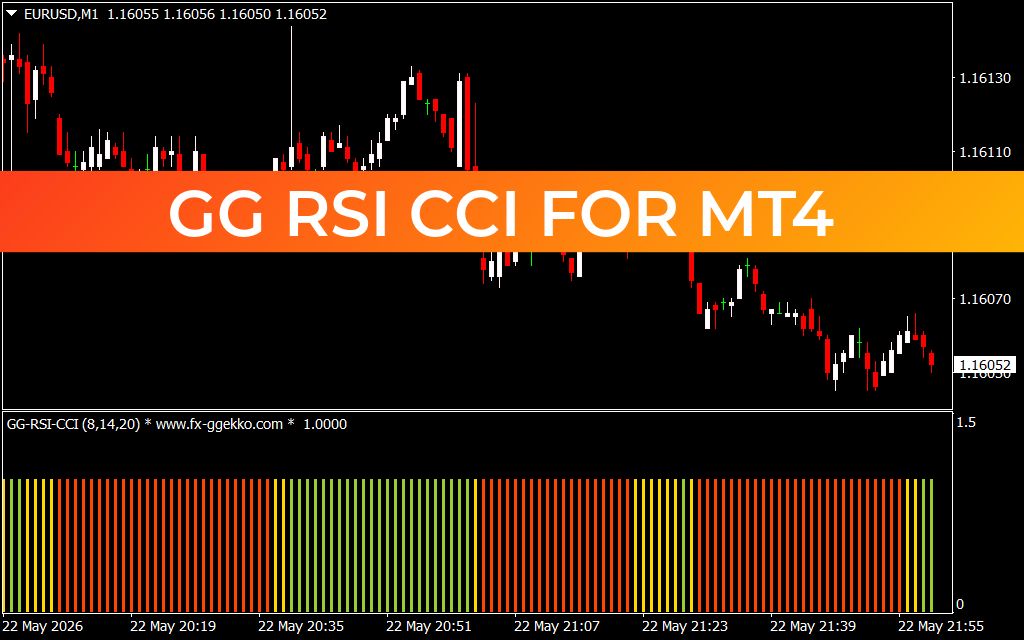
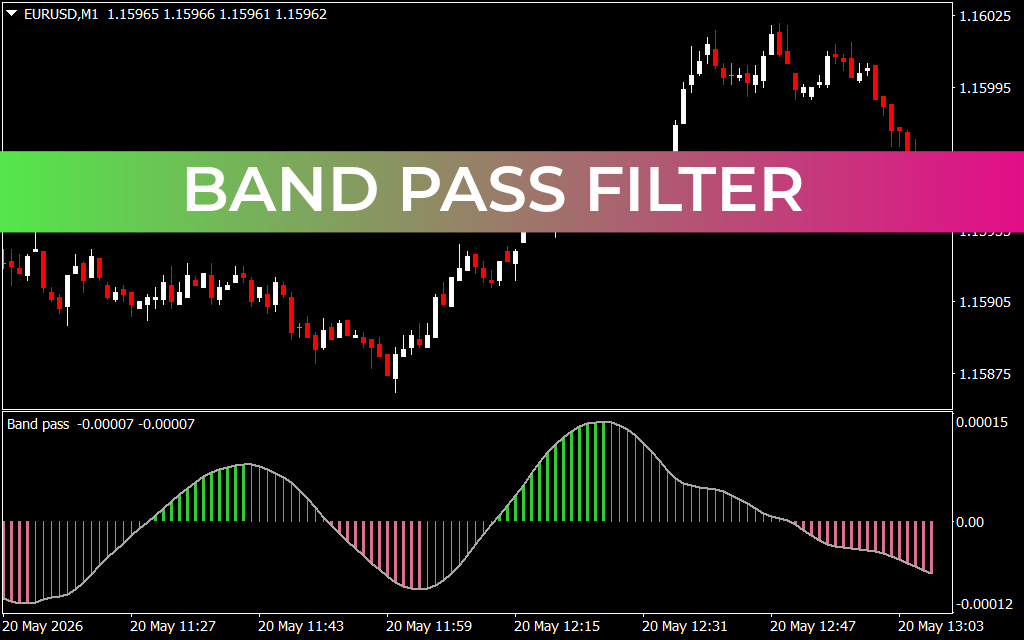
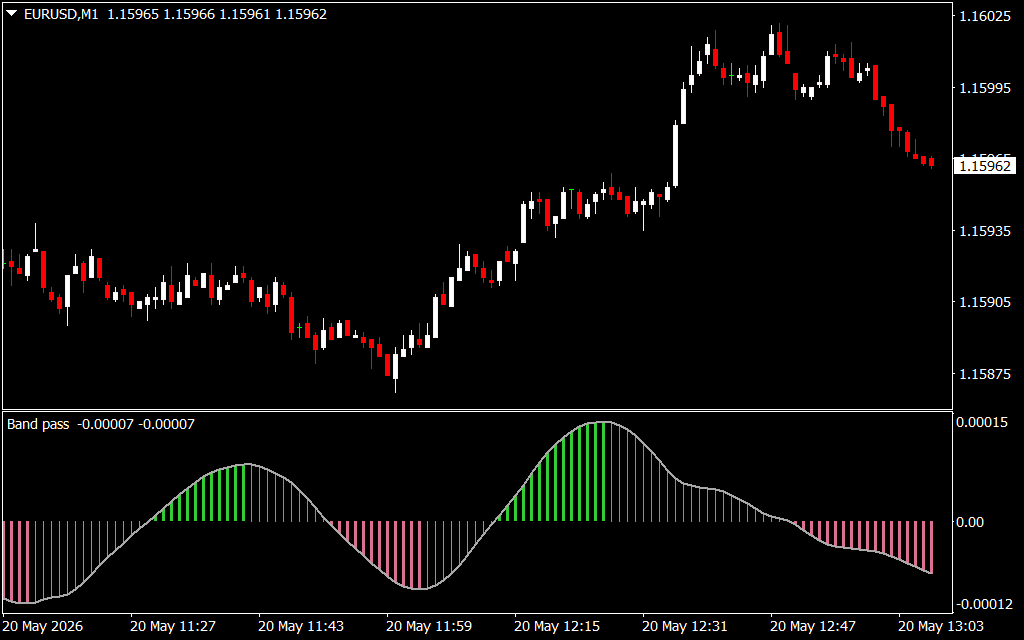
Looking at the EUR/USD M1 chart on May 20th, we see a textbook example of an intraday cycle. The price starts out in a choppy, descending consolidation phase before hitting a defined structural low near 1.15875. From there, institutional buying volume enters the market, launching a sustained, clean trend expansion that drives the exchange rate up past the 1.16010 handle before transitioning back into a distribution phase. To capture these rhythmic swings with clinical accuracy, professional traders isolate underlying market cycles using a Band Pass Filter.
The Mathematics of Signal Processing in Trading
Borrowing from audio engineering and radio frequency processing, a Band Pass Filter is an advanced algorithmic tool designed to isolate a specific frequency or cycle period while completely blocking out everything else. In financial markets, price movement is treated as a composite wave made up of high-frequency noise (minor candle wicks), low-frequency trends (macro cycles), and medium-frequency structural swings.
When applied to the fast-moving M1 EUR/USD structure, this signal-processing software introduces major mechanical advantages:
- Isolating the Core Trading Cycle: The oscillator sub-window displays a smooth, continuous wave that completely strips away the chaotic, jagged steps of standard oscillators. It acts as a lens that brings medium-term market waves into sharp focus, making it simple to spot local swing highs and swing lows.
- Objective Momentum Grading: The indicator features a vertical histogram that changes color based on the slope and position of the cycle line. Bright green bars indicate a clean, high-momentum upward phase, signaling that buyers are firmly in control. Conversely, the transition to muted pink bars alerts traders that the cycle has peaked and a downward mean-reversion phase is underway.
By tracking these clean cyclical waves rather than individual candle fluctuations, day traders can execute technical positions with institutional-grade conviction.
Optimizing Intraday Platform Execution
The difference between a professional scalper and an amateur trader comes down to system clarity. When you filter out chronological market noise, your entry and exit criteria become entirely mechanical. The Band Pass Filter script integrates smoothly into your MetaTrader platform, transforming raw tick data into an actionable roadmap of cyclical peaks and troughs.
The fully customizable interface allows you to fine-tune the filter's bandwidth, modify lookback periods to capture different market regimes, and set up real-time push alerts the exact moment a cycle turns. Integrating this professional tool into your workspace removes emotional guesswork, tightens your stop-loss placement, and ensures your trading capital is always aligned with high-velocity market momentum.
3 Downloads
Last Update:
May 20, 2026 16:08 PM
Published:
Jan 18, 2026 18:43 PM
Category: