Mastering Reversals on the EUR/USD M5 Chart with RSI Divergence
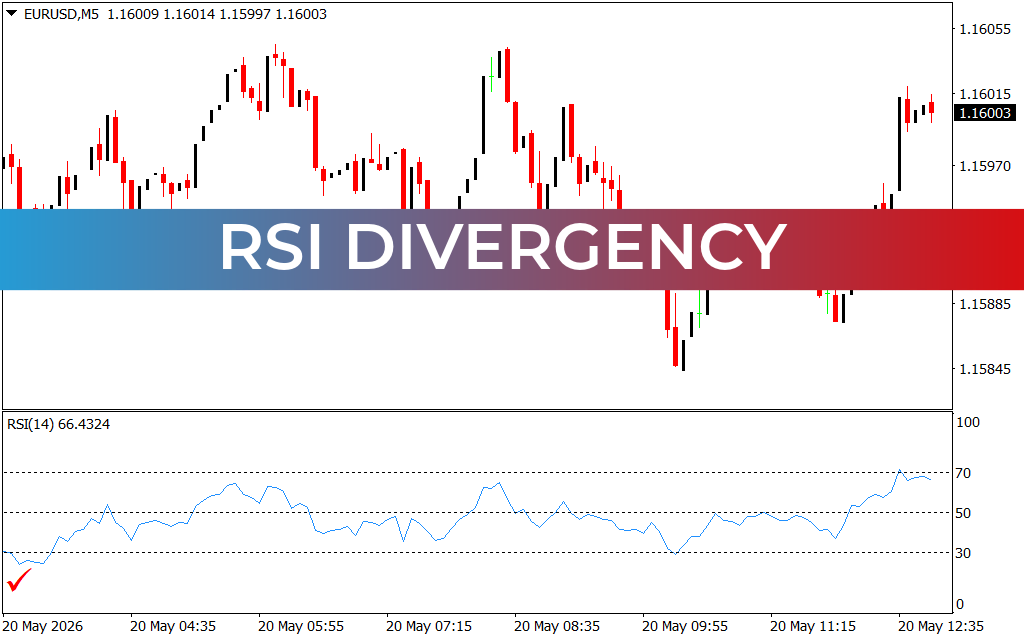
In high-velocity currency markets, timing intraday entries requires absolute precision. Many retail traders suffer significant drawdowns by buying or selling blindly at the absolute peak of an aggressive market extension. On the EUR/USD 5-minute (M5) chart, we see a textbook example of this exact technical challenge during the May 20th session.
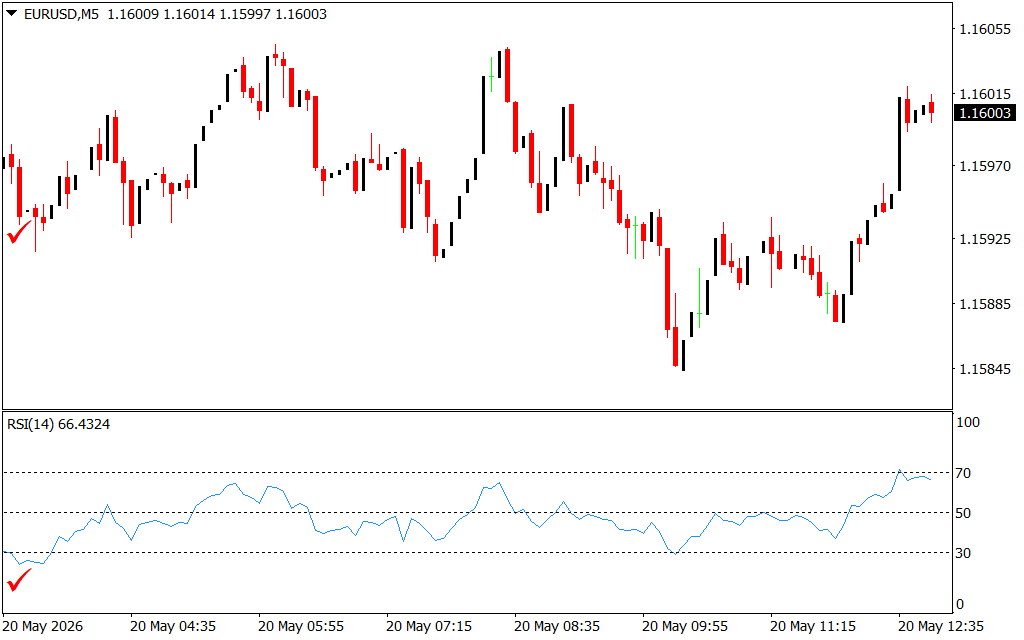
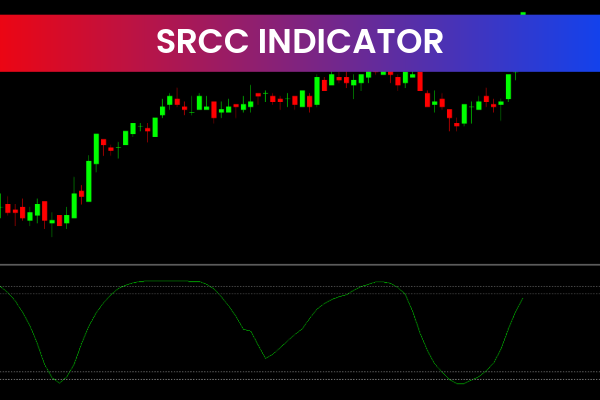
The asset experienced a severe markdown, tumbling from local supply regions down to a structural low near 1.15845. Shortly after this massive drop, the market staged a rapid V-shaped recovery, rocketing upward to breach previous structural pivot zones and touch the 1.16015 handle. Identifying the exact moment a steep trend is losing power is where massive profit margins hide. This is where mastering RSI Divergence gives traders an immense statistical edge.
The Power of Spotting Hidden Momentum Shifts
The Relative Strength Index (RSI) is an established momentum oscillator that tracks the speed and change of price movements. While standard retail indicators are used to simply flag overbought or oversold conditions, professional traders track the relationship between raw price delivery and the oscillator line to uncover underlying volume discrepancies.
Divergence occurs when Price Action moves out of sync with the momentum oscillator, flashing an early warning signal that institutional order flow is shifting direction:
- Bullish Reversal Setups: On the lower boundaries of the May 20th session, notice how price prints a sharp, aggressive lower low on the candlestick chart. However, looking at the RSI panel below, the oscillator prints a distinct higher low, refusing to validate the price drop. This technical mismatch confirms selling pressure is drying up, flagging a high-probability buy zone right before the explosive vertical recovery.
- Confirming Trend Transitions: The checkmarks on the far left side of the chart demonstrate how immediate momentum surges map out clear entry criteria. When the RSI bounces aggressively off its 30 floor while price stabilizes, it confirms an influx of institutional accumulation.
By utilizing these objective momentum mismatches, traders can comfortably execute trades at structural turning points with minimal risk exposure.
Streamlining Technical Chart Analysis
Attempting to scan multiple timeframes manually for subtle divergence patterns introduces emotional bias and costly execution latency. Incorporating an advanced, automated scanner into your platform layout ensures you catch structural shifts instantly. A dedicated indicator script automatically plots trendlines between price peaks and oscillator valleys, alerting you the exact moment a high-concurrency setup forms on major currency pairs. Integrating this institutional tool into your MetaTrader workspace eliminates the guesswork from technical analysis, allowing you to capture high-reward market reversals with absolute confidence.
1 Download
Last Update:
May 20, 2026 16:00 PM
Published:
Jan 18, 2026 18:56 PM
Category: