Mastering the Trend: A Deep Dive into the RSI TC NEW Indicator for MT4
In the fast-paced world of Forex trading, precision is the difference between a winning streak and a drawdown. For traders utilizing the MetaTrader 4 (MT4) platform, the search for indicators that balance sensitivity with reliability is constant. The RSI TC NEW indicator emerges as a sophisticated evolution of the classic Relative Strength Index, designed to filter out market noise and highlight high-probability entry points through intelligent color-coding and signal alerts.
Understanding the RSI TC NEW Advantage
The standard RSI is a momentum oscillator that measures the speed and change of price movements. However, its primary weakness lies in "false signals" during choppy markets. The RSI TC NEW addresses this by integrating advanced smoothing algorithms and trend-confirmation logic.
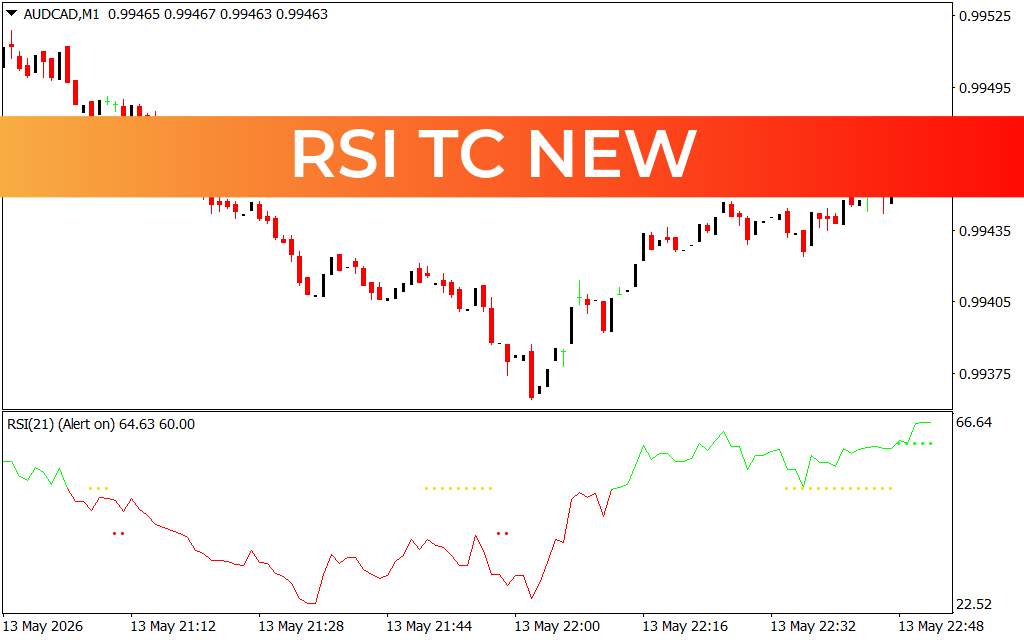
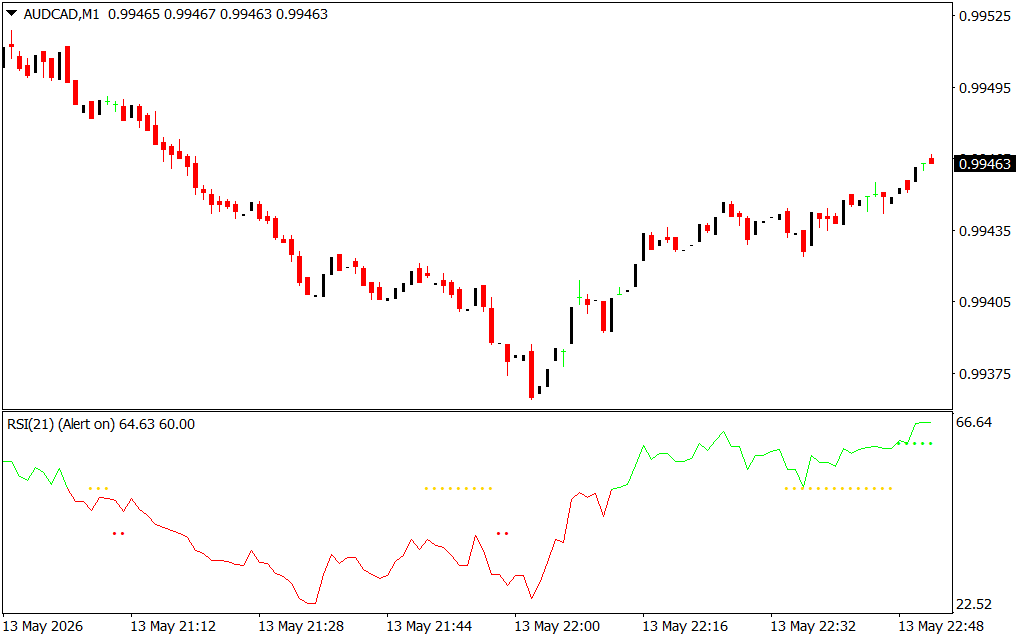
As seen in the recent AUD/CAD M1 Price Action, the indicator doesn't just oscillate; it categorizes market sentiment. The transition from red (bearish momentum) to green (bullish momentum) provides a visual "at-a-glance" confirmation of trend shifts. When the RSI line crosses key thresholds—typically the 30 (oversold) and 70 (overbought) levels—the TC (Trend Confirmation) layer verifies if the move has the volume and price action support to sustain a reversal.
Key Features for Modern Traders
- Dynamic Color Transitions: The indicator changes color based on real-time momentum shifts, allowing traders to stay on the right side of the trend without second-guessing.
- Integrated Alert System: Never miss a setup. The "Alert On" feature notifies you the moment specific conditions are met, which is crucial for scalpers working on M1 or M5 timeframes.
- Customizable Parameters: With a default period of 21 (as shown in the RSI(21) configuration), it offers a smoother, more reliable outlook than the standard 14-period setting, reducing "whipsaw" signals.
- Visual Signal Dots: The inclusion of signal dots on the RSI pane acts as an extra filter, highlighting specific exhaustion points where a retracement is imminent.
How to Trade with RSI TC NEW
To maximize the effectiveness of this tool, traders should look for confluence. For instance, in a downtrend, wait for the RSI TC NEW to turn red and break below the mid-level. Conversely, a long position is signaled when the indicator turns green and exits the oversold territory.
While the M1 chart offers rapid opportunities, the RSI TC NEW shines when used to identify "hidden divergence"—where price makes a lower low, but the indicator makes a higher low. This often precedes the explosive reversals seen in the AUD/CAD recovery shown in the chart.
3 Downloads
Last Update:
May 14, 2026 01:55 AM
Published:
Jan 22, 2026 15:13 PM
Category: