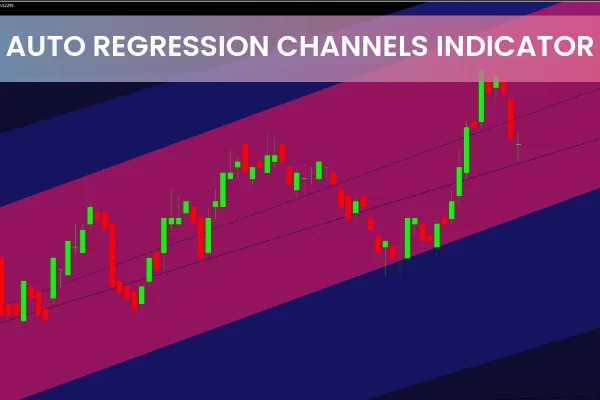
The Auto Regression Channels Indicator for MT4 is a custom trading tool that automatically draws regression channels on your chart, helping traders visualize trend bias and key support/resistance levels. This responsive indicator continuously adjusts and identifies new channels as trends develop or reverse. Available for free at IndicatorForest.com, it is ideal for trend followers, breakout traders, and scalpers alike.
What Are Regression Channels?
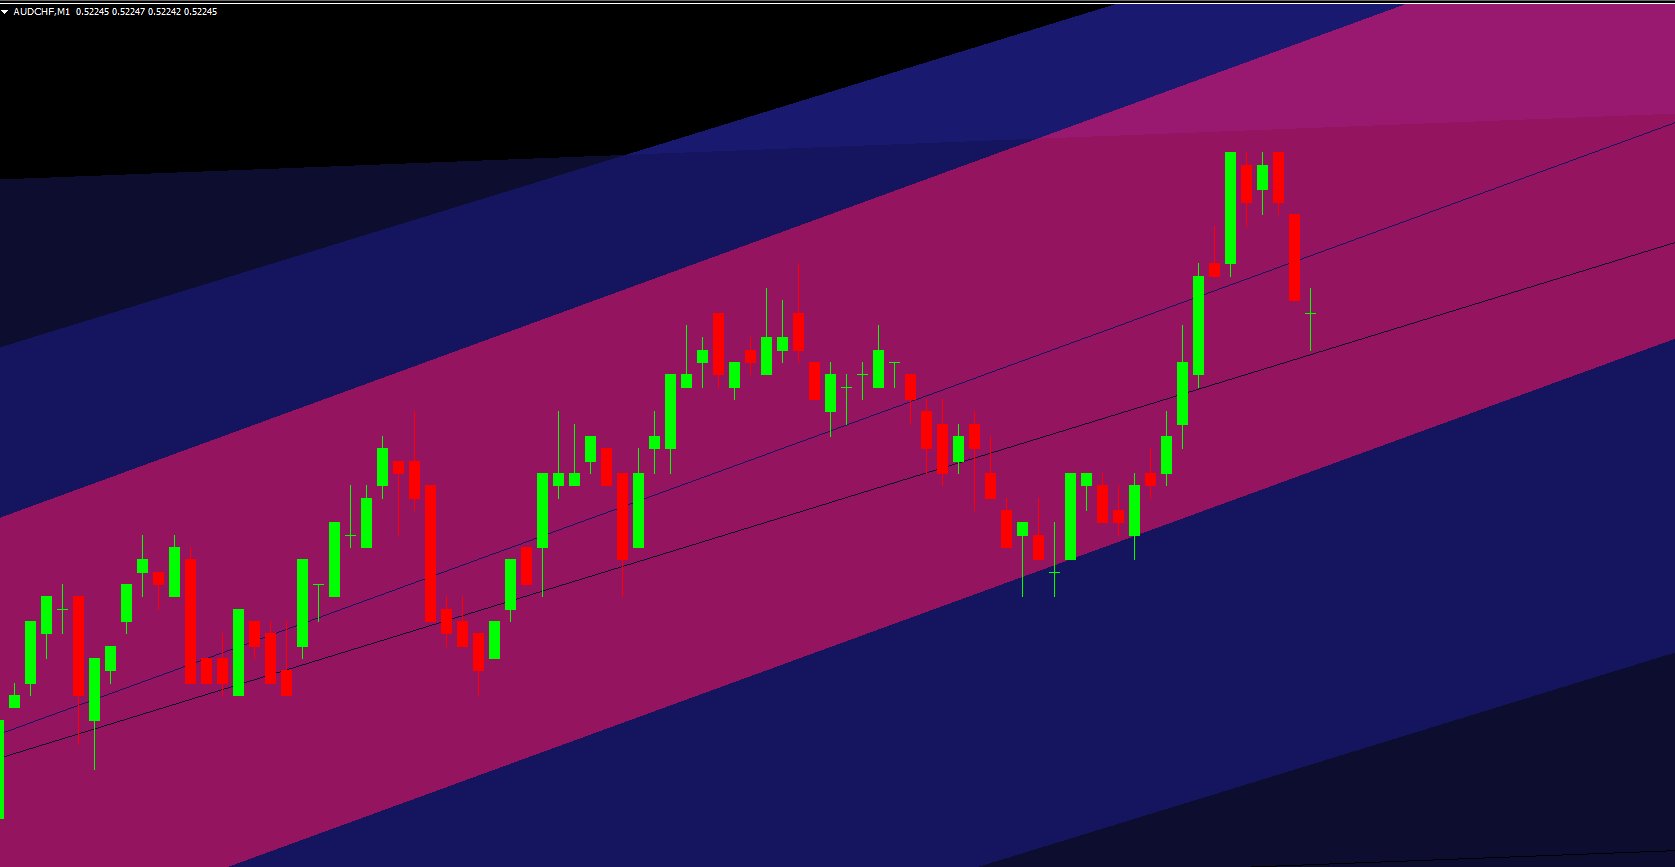
A regression channel is a technical tool used to analyze the trend direction of a financial asset. It consists of:
Centerline: Represents the trend’s average price path.
Upper and Lower Lines: Equidistant parallel lines acting as potential Support And Resistance zones.
Bullish Trend: Centerline slopes upward; price reacts off lower line as support.
Bearish Trend: Centerline slopes downward; price reacts off upper line as resistance.
The Auto Regression Channels Indicator automatically draws multiple channels, giving traders a dynamic view of market trends.
How the Auto Regression Channels Indicator Helps Traders
Trend Trading
The upper and lower boundaries of the regression channels act as support and resistance zones. Traders can:
Enter buy positions when the price reacts to the lower channel line.
Enter sell positions when the price reacts to the upper channel line.
Anticipate Trend Continuation when price respects the channel’s centerline and boundaries.
Breakout Trading
Breakouts above or below the regression channel provide potential reversal or breakout opportunities:
Wait for a breakout and retest of the channel line before entering a trade.
Price often treats broken support or resistance as a new trend direction.
For example:
EURCAD H1: Price rejected multiple times at the lower channel line, signaling a potential bullish continuation.
USDCHF: Price broke out of a bullish channel, retested the upper line, then moved downward, confirming a bearish trend.
How to Trade With the Auto Regression Channels Indicator
Install the Indicator: Add it to your MT4 chart.
Identify Trend Direction: Observe the slope of the regression channel’s centerline.
Look for Support/Resistance Reactions:
Price touches the lower channel line → Potential buy signal
Price touches the upper channel line → Potential sell signal
Trade Breakouts: Enter after price breaks and retests the channel lines for confirmation.
Use in Any Timeframe: Works well for Scalping, intraday, and swing trading.
This indicator simplifies trend and breakout analysis, making it easier to identify trade setups quickly.
Benefits of Using the Auto Regression Channels Indicator
Automatic Channel Drawing: No need to manually plot channels.
Responsive Multi-Timeframe Analysis: Adjusts to evolving trends in real time.
Versatile Trading: Suitable for scalping, day trading, and swing trading.
Clear Support & Resistance Zones: Upper and lower channel lines guide entries and exits.
Free to Download: Accessible for MT4 users.
Conclusion
The Auto Regression Channels Indicator for MT4 is a powerful tool for traders who want to visualize trend bias, detect support and resistance levels, and identify breakout opportunities. Its automatic channel plotting makes it ideal for scalpers, intraday traders, and swing traders. Free to download from IndicatorForest.com, this indicator simplifies trend and breakout analysis while enhancing trading precision.
Download the Auto Regression Channels Indicator today and start identifying high-probability trading setups on your MT4 chart.
FAQ
9 Downloads
Published:
Nov 11, 2025 14:26 PM
Category: