Trend lines are one of the core tools in classical technical analysis and are used by nearly every trader. They help identify the direction of the market trend and potential Support And Resistance zones.
However, drawing valid and accurate trend lines can be challenging — especially when markets are volatile or when multiple possible lines exist. Common problems include:
Frequent redrawing of trend lines
Difficulty in spotting true or false breakouts
Having too many lines, which can clutter your chart
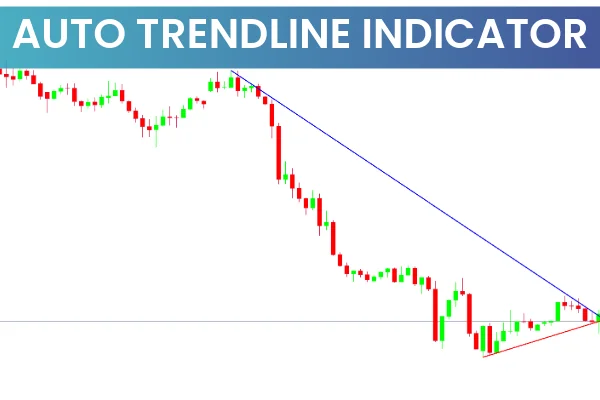
The Auto TrendLine Indicator for MT4 solves these problems by automatically detecting and plotting only the most relevant trend lines that the price is most likely to react to.
Description of the Auto TrendLine Indicator
The AutoTrendLine Indicator is designed to automatically display the most valid trend lines based on recent Price Action. Using mathematical algorithms and filters, it identifies key market structures and updates them dynamically as new data appears.
Key Features
Automatically plots support and resistance lines
Uses built-in filters to show only the strongest and most relevant lines
Adjusts automatically to true breakouts and trend reversals
Removes old or invalid lines in real-time
Works on all timeframes and trading instruments
Simple color-coded display for easy reading
The indicator uses two main lines:
Red Line → Indicates the support line (current upward movement or retracement)
Blue Line → Indicates the resistance line (downward pressure in price)
At first glance, having both lines on the chart might seem confusing, but in practice, it provides a clearer picture of the overall Market Structure.
By comparing the length and slope of these lines, traders can easily identify which trend — bullish or bearish — is currently dominant.
Why Trend Lines Matter
In Forex trading, price movement depends on a wide range of factors — including economic events, market sentiment, and trader behavior.
During high-volatility events such as news releases, price movements can temporarily break through trend lines. Distinguishing between false and true breakouts can be difficult.
The Auto TrendLine Indicator for MT4 simplifies this process by:
Automatically adjusting the slope when new price extremes occur
Redrawing trend lines only when a confirmed breakout or reversal happens
Ignoring minor fluctuations and filtering out market noise
This makes it a powerful tool for identifying the true direction of the trend and key reaction zones in the market.
How to Trade with the Auto TrendLine Indicator
The AutoTrendLine Indicator can be used to trade in two main ways:
Trading with the Trend (Trend Following)
Trading Reversals (Trend Changes)
Trading with the Trend
It’s widely accepted that trading in the direction of the trend is the most profitable approach.
When the price approaches the uptrend line (support) and bounces upward, it signals potential BUY opportunities.
Conversely, when the price touches the downtrend line (resistance) and reverses downward, it provides SELL opportunities.
Trade Example:
When price touches the blue resistance line and fails to break above it, enter a SELL trade.
Place the Stop Loss just beyond the trend line.
Exit the trade when the price breaks the trend line or when a new line forms in the opposite direction.
Trading Trend Reversals
When the Auto TrendLine indicator detects a breakout through one of the trend lines and confirms a trend change, it signals a potential reversal opportunity.
For instance:
If the price breaks above the red downtrend line, it may indicate the start of a new uptrend.
If the price breaks below the blue uptrend line, a downtrend might be forming.
These breakouts can be used to open positions in the direction of the new trend.
Pro Tip: Combine Auto TrendLine with confirmation indicators like MACD, RSI, or Moving Averages for higher accuracy.
Why Use the Auto TrendLine Indicator
Automatic detection: No manual drawing or redrawing needed.
True breakout recognition: Helps you avoid false signals.
Market adaptability: Updates dynamically with every new candle.
Ease of use: Perfect for both beginners and professionals.
Universal application: Works on Forex, stocks, indices, and commodities.
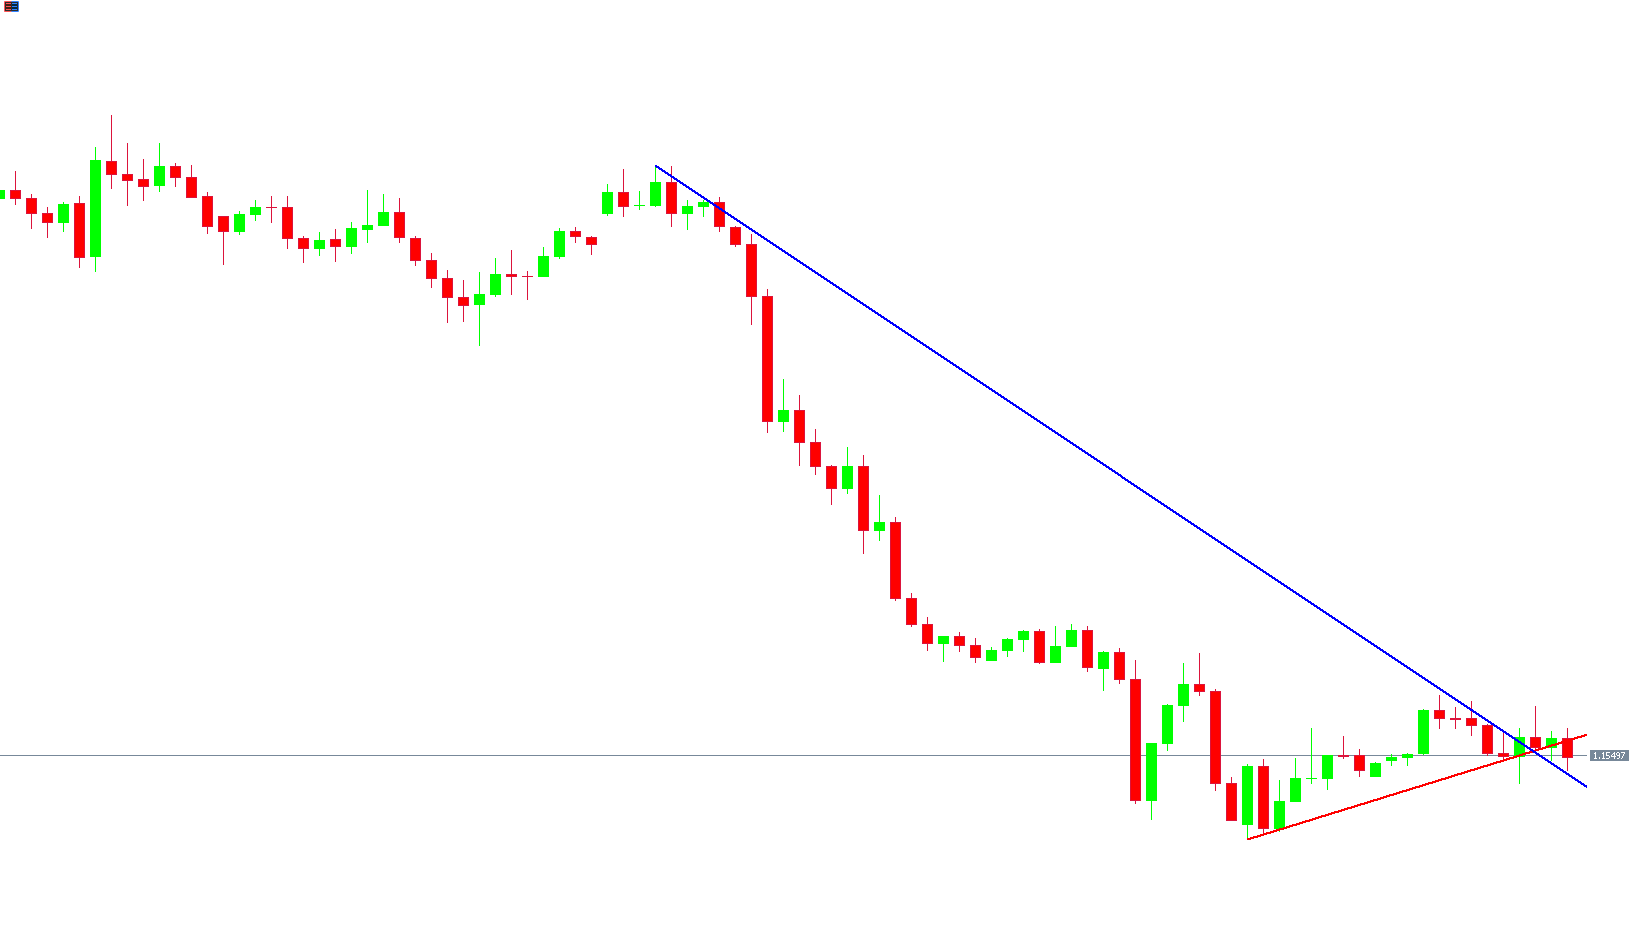
Example Chart Explanation
In the example above, the Auto TrendLine Indicator plots two main lines:
The blue resistance line showing the upper limit of the price.
The red support line showing the lower boundary of the trend.
When price growth near the uptrend line starts to slow, and additional confirmation indicators show weakness, this suggests selling pressure.
A SELL trade can be opened with a Stop Loss beyond the red line and closed at the next support or during a Trend Reversal.
Conclusion
The Auto TrendLine Indicator for MT4 is a powerful tool that simplifies the process of identifying key trend lines, support, and resistance levels.
It eliminates guesswork and helps traders stay aligned with the dominant market direction by showing accurate, automatically updated trend lines.
While it should not be used as a standalone tool, combining Auto TrendLine with other indicators or Price Action strategies can significantly improve your trading results.
Download the Auto TrendLine Indicator for MT4 for free at IndicatorForest.com and start spotting precise trend lines automatically today.
FAQ
12 Downloads
Published:
Nov 10, 2025 11:52 AM
Category: