The Traders Dynamic Index is built on the RSI (Relative Strength Index) to determine Trend Strength. It incorporates:
Green Line: Shows market sentiment and acts like the RSI, reflecting how the market reacts to buying and selling pressure
Red Line: Intersection with the green line, often used for market entry and exit signals
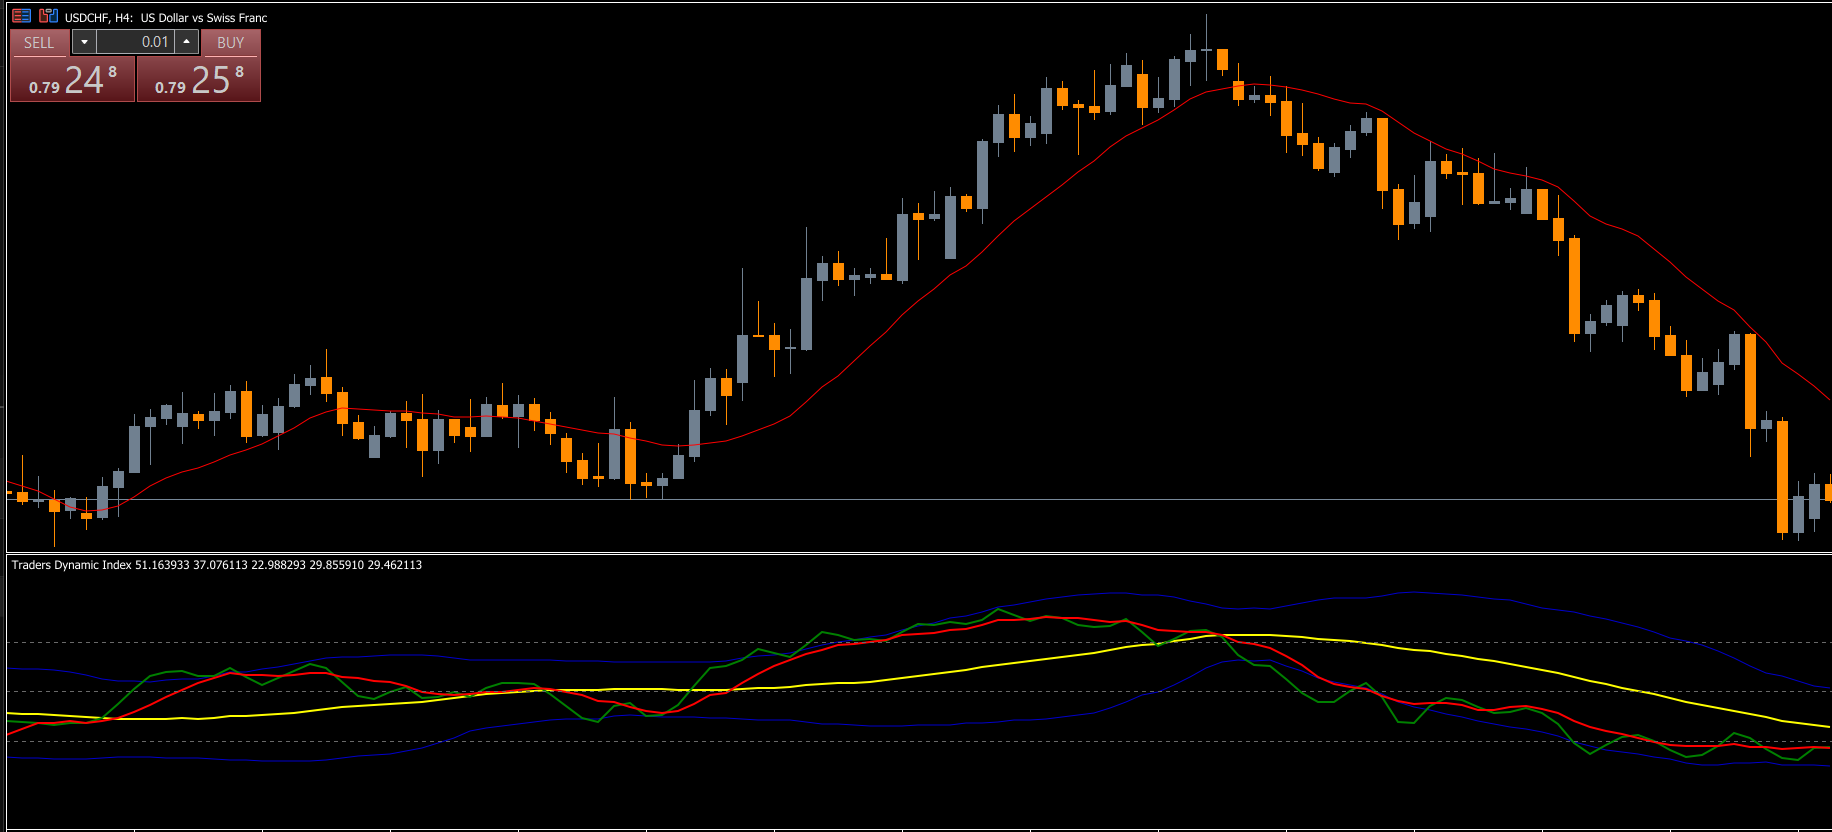
Yellow Line: Reflects general market sentiment and trend direction, connecting all other lines for long-term trend analysis
Blue Lines (Upper & Lower): Function like Bollinger Bands to indicate market volatility
By combining these components, the TDI RT indicator provides a clear picture of market conditions in one view, making it ideal for traders who want both trend and volatility insights simultaneously.
How to Use the TDI RT Indicator
Trend Identification
Green Line Above Red Line: Short-term trend shifts upward
Green Line Below Red Line: Short-term trend shifts downward
Yellow Line: Helps identify long-term trends; deviations from its trajectory indicate potential trend reversals
Market Strength
A steep slope of the green line indicates strong market participation
A flat green line indicates a quiet or inactive market
Widening blue Bollinger Bands show increased volatility
Narrowing blue bands indicate low volatility or upcoming significant events
Trading Strategy Using TDI RT
Buy Setup
Green line above red and yellow lines
Wait for a bullish candlestick confirmation
Place stop-loss near the recent swing low
Exit when green line crosses below red line
Sell Setup
Red line above green and yellow lines
Wait for a bearish candlestick confirmation
Place stop-loss near the recent swing high
Exit when red line crosses below green line
The TDI RT indicator is most effective on H1 or higher timeframes and for assets with stable volatility, such as major Forex pairs.
Benefits of the TDI RT Indicator
Combines RSI, moving averages, and Bollinger Bands for an all-in-one trading view
Identifies trend direction and strength clearly
Highlights market volatility to manage risk effectively
Provides both short- and medium-term trading signals
Suitable for Forex, commodities, and indices with stable price behavior
By using the TDI RT indicator, traders can enhance trade timing and reduce exposure to false signals, making it a reliable companion for systematic trading.
Conclusion
The Traders Dynamic Index (TDI RT) Indicator for MT5 is a versatile tool that gives traders a complete view of market trends, strength, and volatility. By analyzing the green, red, yellow, and blue lines, traders can identify high-probability trade setups with better precision.
This indicator is especially recommended for major Forex pairs and assets with predictable volatility. For more MT5 indicators and free trading tools, visit IndicatorForest.com.
FAQ
14 Downloads
Published:
Nov 13, 2025 22:09 PM
Category: